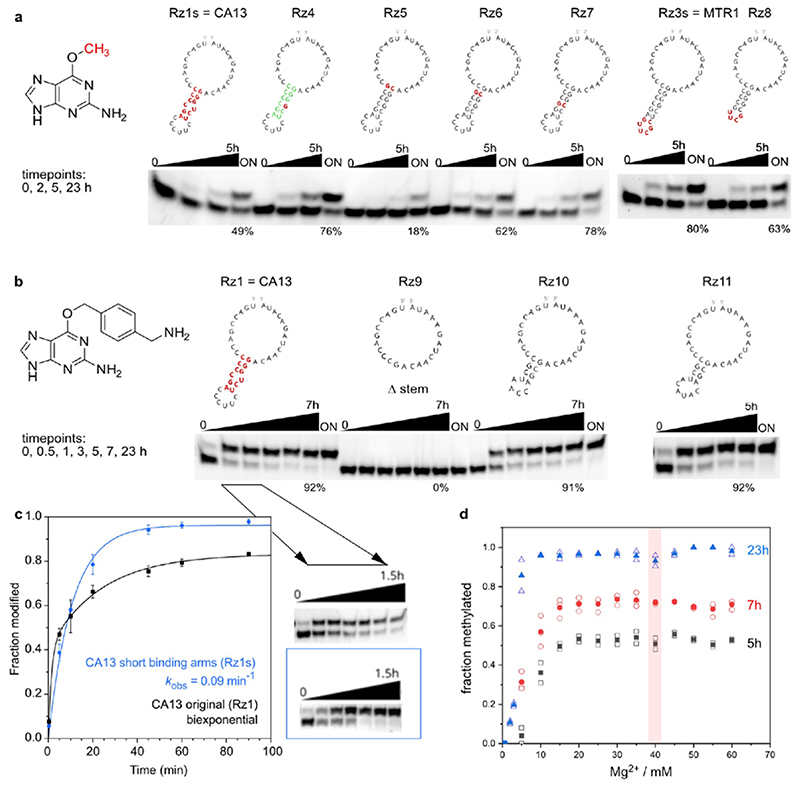
Figure 2. Extended Data Figure 2.
Activity of methyltransferase ribozymes: Examination of mutations in the stem-loop. a. 3'-Fluorescein-labeled R10a tested with 100 μM m6G, b. 5'-Fluorescein-labeled R1 tested with 100 μM BG-NH2. ON = over night (23 h) c. Kinetics of CA13 (Rz1/Rz1s)-catalysed alkylation of R1 using BG-NH2 cofactor. Fraction modified is shown as mean ± stdev (n = 3), and fit to a monexponential model (Y = Ymax (1 – e–kt), blue), or a biexponential model (Y = Ymax (a (1 – e–k1t) + (1 – a) (1 – e–k2t)), black). d. Dependence of MTR1 methylation yield on Mg2+ concentration, reactions performed with 100 μM m6G (on R2 with Rz3) at 37°C. Individual data points are shown as empty symbols (n = 2 for 5 h and 23 h, n = 3 for 7 h timpoints), and mean is depicted as filled symbol.

