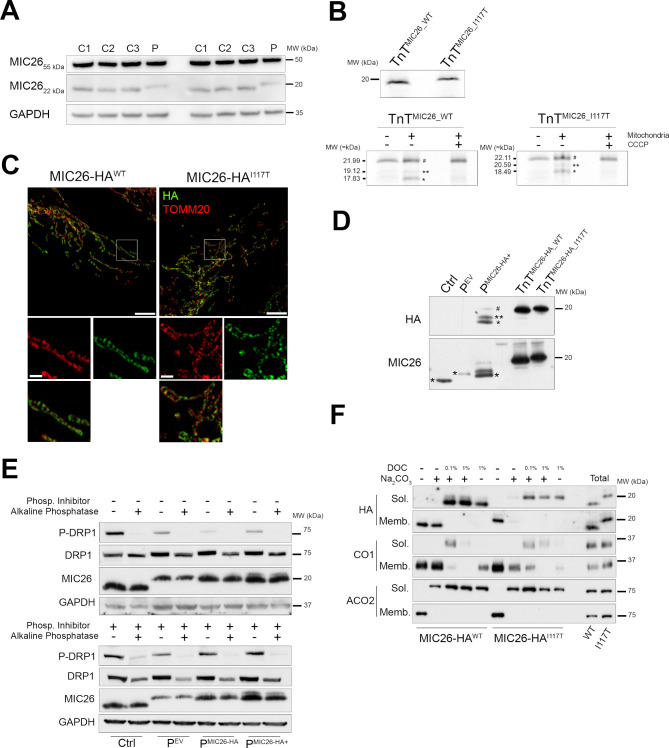
Figure 2.
MIC26I117T binds weakly to the inner membrane due to incorrect precursor processing. (A) SDS-PAGE for MIC26 and GAPDH showing the cytosolic (55 kDa) and mitochondrial (22 kDa) MIC26 isoforms in Ctrls (C1, C2 and C3) and P. Representative image of five biological replicates. (B) TnT and in vitro organelle import of MIC26 WT and mutant showing # and two imported processed forms (* and **). Representative image of two biological replicates. (C) Representative N-SIM micrographs of HeLa cells expressing MIC26WT-HA or MIC26I117T-HA labelled with anti-HA and anti-TOMM20 antibodies. Maximum intensity projection is shown. Scale bars: 5 µm, inset: 1 µm. Representative image of three biological replicates. (D) SDS-PAGE blotted for HA and MIC26 showing Ctrl, PEV, overexpressing MIC26 WT (PMIC26-HA+) and rabbit reticulocytes lysates after in vitro transcription/translation of MIC26 WT (TnTMIC26-HA_WT) and mutant (TnTMIC26-HA_I117T). Cytoplasmic #, ** and *. (E) SDS-PAGE for P-DRP1 (S616), DRP1, MIC26 and GAPDH in total lysates treated with (+) or without (−) phosphatase inhibitors and akaline phosphatase from fibroblasts: Ctrl, PEV (expressing empty vector), PMIC26-HA (MIC26-HA WT – low levels), PMIC26-HA+ (MIC26-HA WT high levels), representative image of two biological replicates. (F) SDS-PAGE for HA, CO1 and ACO2 from different mitochondrial fractions (sol and memb) of HeLa cells overexpressing MIC26-HAWT and MIC26-HAI117T. Representative image of two biological replicates. GAPDH, glyceraldehyde-3-phosphate dehydrogenase; MW, molecular weight; #, non-imported precursor; *, intermediate form; **, mature form; CCCP, Carbonyl cyanide 3-chlorophenylhydrazone; HA, human influenza hemagglutinin; N-SIM, Nikon structured illumination microscope; Memb, membrane bound; Sol. soluble; Ctrl, control; P, proband fibroblast; PEV, P fibroblasts expressing empty vector; SDS-PAGE, sodium dodecyl sulfate–polyacrylamide gel electrophoresis.

