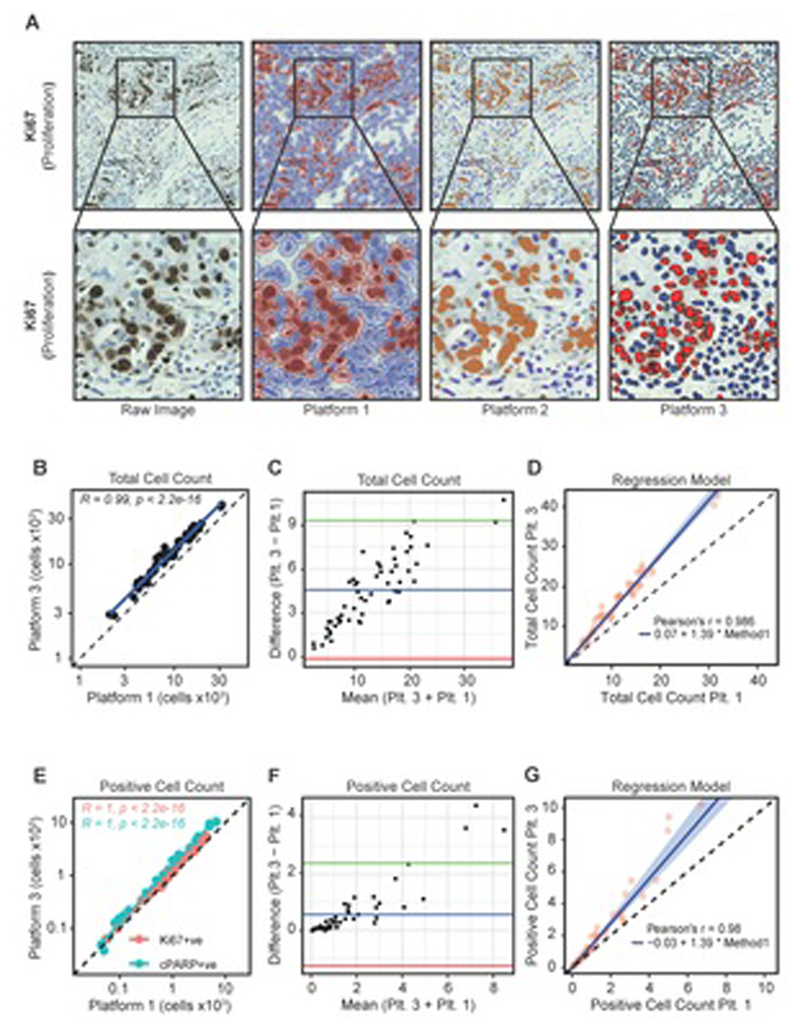
Figure 2. Comparison of digital platforms.
a Digitisation of Ki67-stained IHC raw images using three software packages. PDEs were stained for Ki67 by IHC and visualised with DAB. The slides were then imaged using a Hamamatsu Nanozoomer XR and analysed using three digital pathology image analysis platforms (QuPath, ImmunoRatio and VisioPharm; Platforms 1-3 respectively). For all platforms, red/orange indicates DAB positivity and blue indicates DAB negative cells.
b Pearson’s correlation coefficient comparing Platform-1 and Platform-3 values for total cells counted across 56 NSCLC PDEs.
c Bland-Altman plot comparing total cell counts as determined by Platform-1 and Platform-3. The blue line indicates the mean difference between total counts, the green and red lines illustrate the upper and lower limits of agreement based on 95% CIs, respectively.
d Passing-Bablok regression model illustrating a proportional difference in total cell counts between Platform-1 and Platform-3.
e Pearson’s correlation coefficient comparing Platform-3 and Platform-1 for Ki67+ve and cPARP+ve cell counts across 56 PDEs.
f Bland-Altman plot comparing Platform-3 and Platform-1 for Ki67+ve/cPARP+ve cell counts. The blue line indicates the mean difference between positive counts while the green and red lines illustrate the upper and lower limit of agreement based on 95% CIs, respectively.
g Passing-Bablok regression model illustrates a proportional difference in positive cell counts between Platform-3 and Platform-1.

