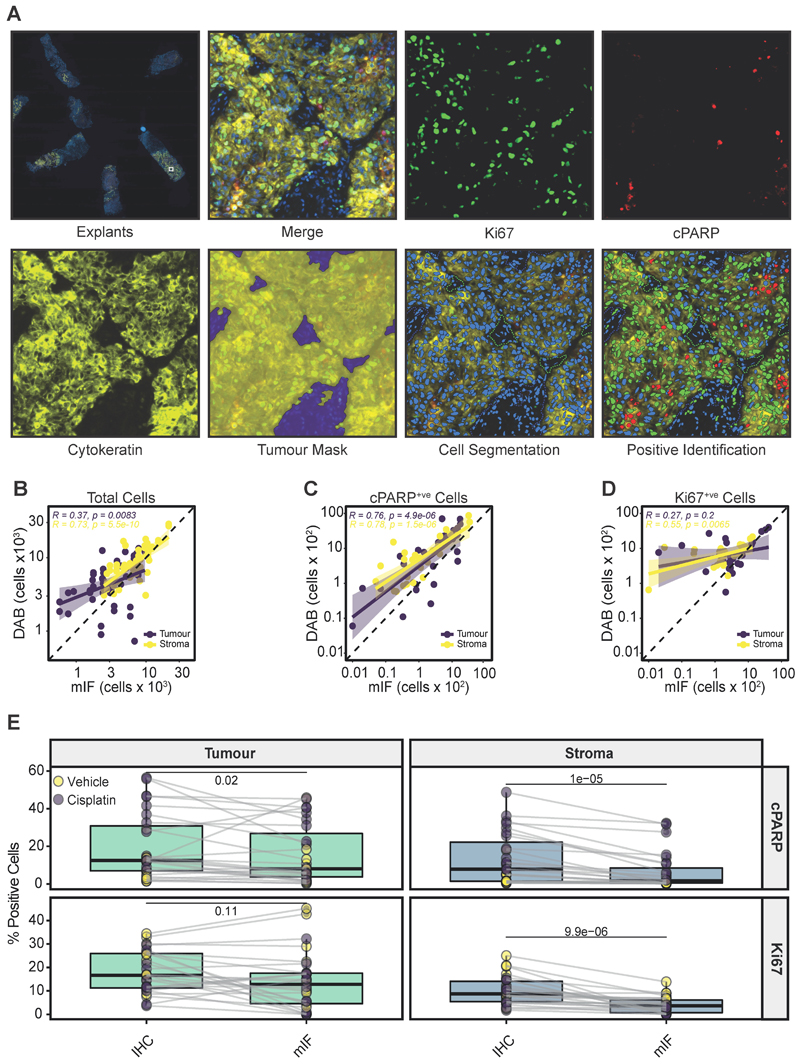
Figure 5. Comparison of mIF and IHC.
a Representative example of mIF-stained PDEs for Ki67 (green), cPARP (red), cytokeratin (yellow) and DAPI (blue). Individual stains and merged images are shown. A tumour mask (yellow) and stromal tissue (blue) were identified following cellular segmentation, allowing positive stain identification on a single slide. A lower power view of mIF-stained explants on a single slide is shown in the upper left panel.
b Pearson’s correlation of the total cells identified in tumour and stroma in mIF slides versus virtual double staining (IHC).
c Pearson’s correlation of cPARP+ve cells in the tumour and stroma in mIF sections versus virtual double staining (IHC).
d Pearson’s correlation of Ki67+ve cells identified in tumour and stroma in mIF sections versus virtual double staining (IHC).
e % Ki67+ve and % cPARP+ve cells identified in stroma and tumour regions when analysed by mIF or by IHC using the VDS approach. The Wilcoxon paired test was used to test for significance. Each point represents a single PDE.

