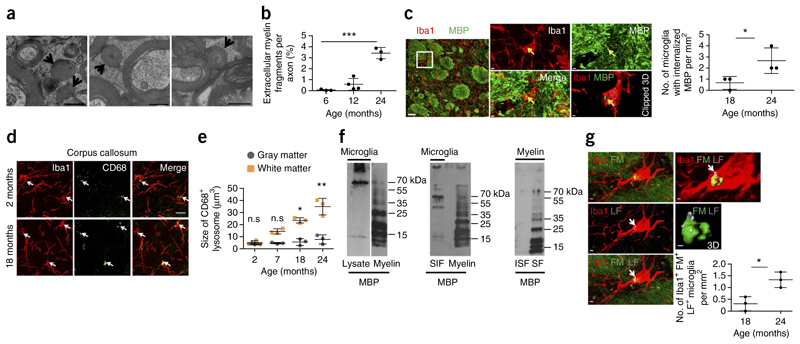
Figure 1. Microglia clear away myelin fragments in the aging brain.
(a) High-pressure freezing for electron microscopy was performed on the optic nerve (24-month-old mice shown). Arrows point to myelin fragments; scale bar, 300 nm. (b) Quantification of myelin fragments per axon (n = 3 mice per group; mean ± s.d.; one-way ANOVA, ***P < 0.0001, F = 50.34, d.f. = 9; followed by Bonferroni’s post hoc test, 6 vs. 24 months, ***P < 0.0001, t = 9.253; 12 vs. 24 months, ***P = 0.0007, t = 8.225). (c) Confocal image shows colocalization of MBP-immunoreactive puncta (green) with Iba1-positive microglia (red) with age. Clipped 3D reconstruction of microglia (see Online Methods) shows MBP (arrows) inside the cell. Scale bars, 30 μm (left); 2 μm (center, top right); 1 μm (clipped 3D). Quantification of number of MBP immunoreactive puncta colocalizing with Iba1-positive microglia in the white matter (n = 3 mice per group; mean ± s.d.; *P = 0.0415, t = 2.112, d.f. = 2; Student’s two-tailed t test). (d) Visualization of CD68-positive lysosomes (green, marked by white arrows) and microglia (Iba1, red) in wild-type mice. Scale bar, 15 μm. (e) Quantification of lysosomal size in microglia of white and gray matter (n = 3 mice per group; mean ± s.d.; two-way ANOVA, brain region effect, ***P = 0.0006, F = 20.17, d.f. = 1; followed by Bonferroni’s post hoc test, 2 months, P = 0.7236, t = 0.1205; 7 months, P = 0.6356, t = 1.709; 18 months, *P = 0.0321, t = 3.139; 24 months, **P = 0.0065, t = 3.923). Each dot represents the mean value of 40 cells. (f) Left, western blot analysis of purified microglia lysates from 1-year-old mice shows MBP in the high molecular weight region; MBP in myelin is shown as a reference in the right lane. Middle, high-molecular weight species of MBP existed in the sarkosyl-insoluble fraction (SIF) of microglial membranes (1-year-old mice); MBP in myelin is shown as a reference in the right lane. Right, sarkosyl extraction on purified myelin shows that myelin-associated MBP is sarkosyl soluble (sarkosyl-soluble membrane fraction, SF). Full-length blots are presented in Supplementary Figure 10. (g) Colocalization of myelin fragments (FluoroMyelin, FM, green) with lipofuscin (LF, gray, marked with white arrows) within microglia (red) in a 24-month-old mouse. Scale bars, 2 μm. Quantification shows number of puncta positive for FluoroMyelin (FM) and lipofuscin colocalizing with Iba1-positive microglia in the white matter (n = 3 mice per group, mean ± s.d.; *P = 0.0356, t = 2.513, d.f. = 3; Student’s two-tailed t test). In b, c and g each dot represents the mean value of 3 brain slices per mouse. All images are representative of three independent experiments and western blots of five.

