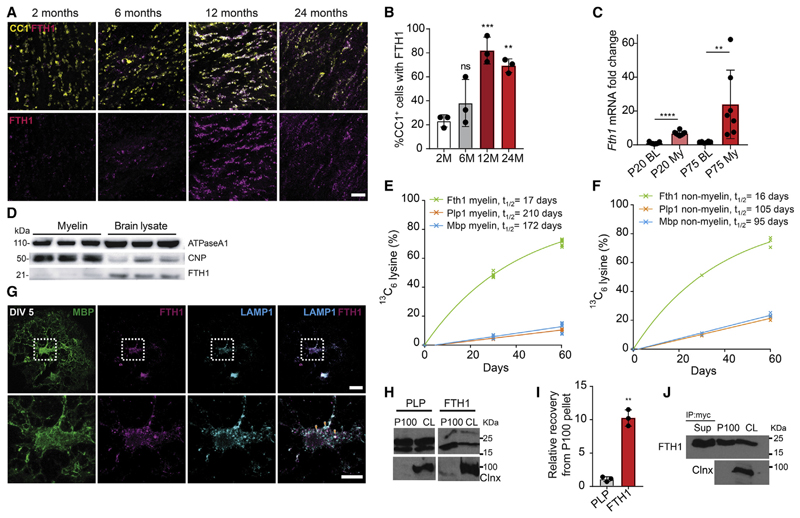
Figure 3. Ferritin Heavy Chain Is Released from Oligodendrocytes and Protects against Neuronal Cell Death.
(A) Images of corpus callosum brain sectionsfrom wild-type mice of the indicated ages(2,6,12, and 24 months) immunostained for CC1 (mature oligodendrocyte marker) and FTH1. Scale bar, 50 μm.
(B) Quantification of the percentage of CC1 + cells showing co-labeling with FTH1 at the indicated ages. All data are means ± SD; ns, non-significant; **p < 0.01, ***p < 0.001, by one-way ANOVA with Dunnett’s multiple comparison test.
(C) Relative change of Fth1 mRNA expression in brain lysates (BL) compared to myelin fractions (My) from P20 and P75 wild-type mice. Data are means ± SD; comparison between P20BL versus P20My and P75BL versus P75My by two-tailed unpaired Student’s t test. **p < 0.01, ***p % 0.0001.
(D) Immunoblot analyses of brain lysates and myelin fractions obtained from P75 wild-type mice probed with the indicated antibodies.
(E and F) Quantification of protein lifetime for PLP, MBP, and FTH1 in myelin (E) and non-myelin fractions (F).
(G) Representative images of cultured primary oligodendrocytes fixed at 5 days in vitro (DIV) and stained for MBP (green), FTH1 (magenta), and LAMP1 (cyan). Lower panel represents higher magnification of indicated (white box) area of the upper panel. Orange arrow heads show FTH1/LAMP1 co-localization. Scale bar, 10 μm.
(H) Western blot of FTH1, PLP, and Calnexin (Clnx) in cell lysates (CL) and the EV-enriched 100,000g pellets (P100) of primary cultures of oligodendrocytes. Calnexin was used as a negative control forthe P100 fraction. The membranes were cut at 55 kDa and the respective halves were probed for FTH1 and Calnexin.
(I) Quantification of relative amounts of PLP and FTH1 in P100 normalized to their respective cell lysates. Data are means ± SD; **p < 0.01 by two-tailed paired Student’s t test.
(J) Representative western blot of cell lysate (CL), P100, and supernatant of P100 (Sup) fractions immunoprecipited using anti-myc antibody from Oli-neu cells transfected with myc-tagged FTH1. The blot was probed with antibodies against c-myc and Calnexin (Clnx).

