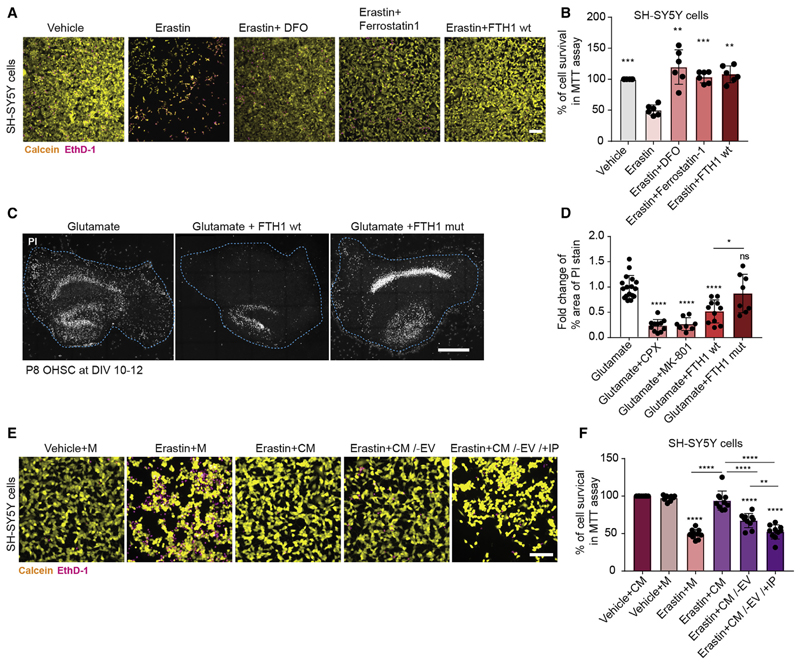
Figure 4. Ferritin Heavy Chain Protects against Ferroptotic Neuronal Cell Death.
(A) Images of SH-SY5Y cells treated with vehicle, 20 μM erastin, 20 μM erastin + 50 μM DFO, 20 μM erastin + 10 μM ferrostatin-1, or 20 μM erastin + 10 μg wildtype FTH1. Cells were stained 24 h post treatment with calcein (yellow) to mark living cells and with ethidium homodimer-1 (EthD-1, in magenta) to label dead cells. Scale bar, 100 μm.
(B) Quantification of percentage of living SH-SY5Ycells, following 24 h of treatment with vehicle, 20 μM erastin, 20 μM erastin + 50 μM DFO, 20 μM erastin + 10 μM ferrostatin-1, or 20 μM erastin + 10 μg FTH1wt. The percentage of cell survival was quantified using the colorimetric MTT assay. All data are means ± SD; **p < 0.01, ***p < 0.001 by one-way ANOVA with Dunnett’s post hoc test for multiple comparison. All samples were compared to erastin (second column).
(C) Images of organotypic hippocampal slice cultures (OHSC) stained with propidium iodide dye(PI) 16h after being treated with 1 mM glutamate, 40 μgwild-type FTH1 (wt), or catalytically inactive (E62K and H65G) FTH1 mutant (mut). Scale bar, 500 μm.
(D) Quantification of the fold change of percentage of area occupied by dead cells (PI stained cells) after 16 h of treatment as indicated (40 μg FTH1 wt or FTH1 mut, 5 μM ciclopirox olamine [CPX], 10 μM MK-801).
(E) Images ofSH-SY5Y cells treated with vehicle + oligodendrocyte culture media (M), 20 μM erastin + M, 20 μM erastin + oligodendrocyte conditioned medium (CM), 20 μM erastin + 100,000g supernatant of CM (CM/−EV), or 20 μM erastin + 100,000g supernatant of CM after immunodepletion with FTH1 antibodies to remove free FTH1 (CV/−EV/+IP). Cells were stained 24 h post treatment with calcein (yellow) to mark living cells and with ethidium homodimer-1 (EthD-1, in magenta) to label dead cells. Scale bar, 100 μm.
(F) Quantification of percentage of living SH-SY5Y cells, following 24 h oftreatment with vehicle + CM, vehicle + M, 20 μM erastin + M, 20 μM erastin + CM, 20 μM erastin + CM/−EV, or 20 μM erastin + CM/−EV/+IP. The percentage of cell survival was quantified using the colorimetric MTT assay. All samples were compared to vehicle + CM (first column), unless indicated by lines.
In (D) and (F), all data are means ± SD; ns, non-significant; *p < 0.05,**p < 0.01,***p < 0.001, ****p < 0.0001 by one-way ANOVA with Tukey’s post hoc test for multiple comparison.

