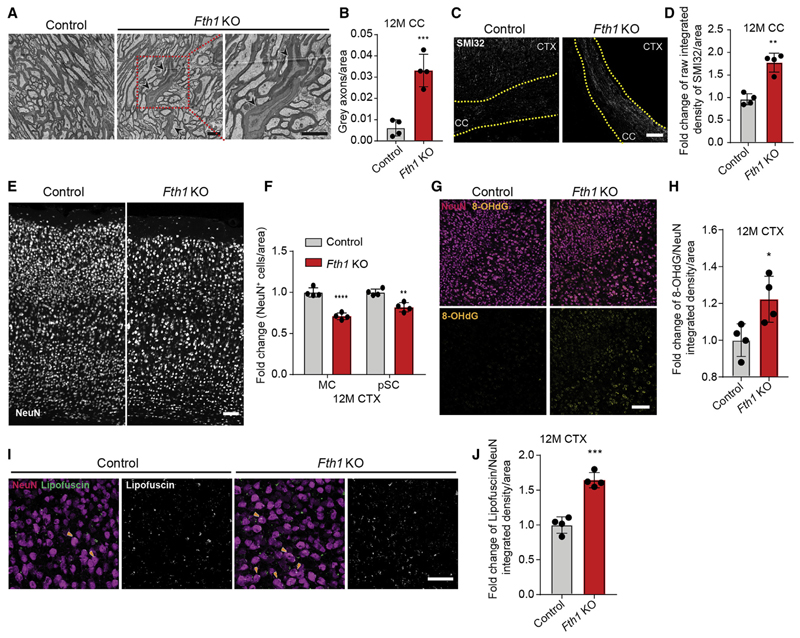
Figure 5. Oligodendrocyte-Specific Ferritin Heavy Chain Knockout Results in Neuronal Loss and Oxidative Damage in Mice.
(A) Electron micrograph images of corpus callosum brain sections from 12-month-old oligodendrocyte-specific Fth1 KO (Fth1fl/fl;PLPCreERT2/wt) and control mice (Fth1fl/fl; PLPwt/wt) 10 months after tamoxifen induction. Neighboring panel represents higher magnification image of indicated part (red box). Black arrow heads indicate axons with dark cytoplasm. Scale bar, 2 μm.
(B) Quantification of dark axons/area in Fth1 KO (red) and control (gray) mice at 12 months.
(C) Images of 12-month-old control and Fth1 KO mice corpus callosum immunostained with antibodies against unphosphorylated neuroflament (SMI32). Scale bar, 100 μm.
(D) Quantifcation of relative SMI32 integrated density per area.
(E) Images of 12-month-old control and Fth1 KO mice neocortex immunostained with antibodies against neuronal nuclei (NeuN). Scale bar, 100 μm.
(F) Quantification of relative density of NeuN+ cells/area of 12-month-old Fth1 KO and control mice motor (MC) and primary sensory cortex (pSC). Data are means ± SD; **p < 0.01, ****p < 0.0001 by two-way ANOVA with Sidak’s multiple comparison test.
(G) Images of 12-month-old control and Fth1 KO mice neocortex immunostained with antibodies recognizing oxidative DNA modifications (8-OHdG, yellow) and NeuN (magenta). Scale bar, 100 μm.
(H) Quantification of relative 8-OHdG integrated density per NeuN+ area.
(I) Images of autofluorescent lipofuscin (white) in NeuN+ cells (magenta) in neocortex of 12-month-old Fth1 KO and control mice. Orange arrow heads indicate lipofuscin (white) accumulated inside NeuN+ cell bodies. Scale bar, 50 μm.
(J) Quantification of relative lipofuscin fluorescence integrated density per NeuN+ area.
In (B), (D), (F), (H), and (J), all data are means ± SD; *p < 0.05, **p < 0.01, ***p < 0.001 by two-tailed Student’s t test.
See also Figures S3 and S4.

