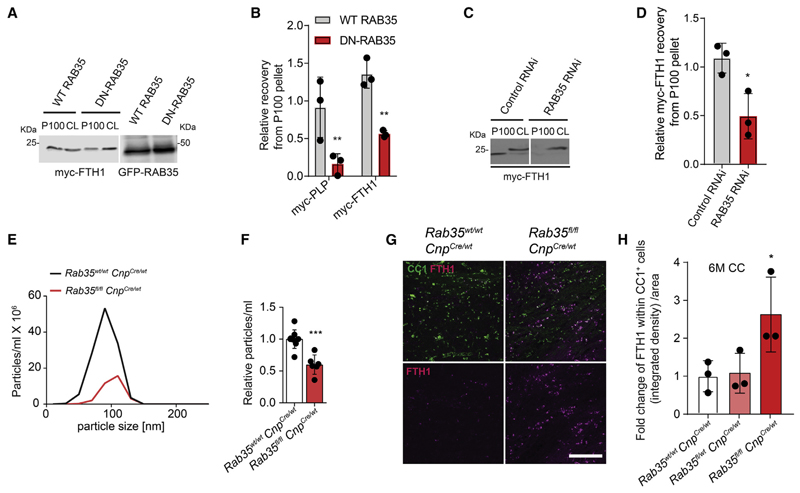
Figure 6. Oligodendrocytes Secrete Ferritin Heavy Chain in a RAB35-Dependent Manner.
(A) Western blot of cell lysate (CL) and 100,000g pellets (P100) from Oli-neu cells transfected with myc-tagged FTH1 together with wild-type EGFP-RAB35 (WT-RAB35) or dominant-negative EGFP-RAB35N120I (DN-RAB35).
(B) Quantification of relative amounts of myc-FTH1 and myc-PLP in P100 normalized to cell lysates. Data are means ± SD; **p < 0.01 by two-way ANOVA with Sidak’s multiple comparison test.
(C) Western blot of cell lysate (CL) and 100,000g pellets (P100) from Oli-neu cells treated with control RNAi or RAB35 RNAi and transfected with myc-tagged FTH1.
(D) Quantification of relative amounts of myc-FTH1 in P100 normalized to cell lysates upon knockdown of RAB35. Data are means ± SD; *p < 0.05 by two-tailed Student’s t test.
(E) Representative nanoparticle tracking analysis size distribution profile for 100,000g pellets obtained from culture medium of Rab35 KO (Rab35fl/fl;CnpCre/wt) (red) and control oligodendrocytes (Rab35wt/wt;CnpCre/wt) (black).
(F) Quantification of number of particles released in the medium of cultured Rab35 KO (red) and control (white) oligodendrocytes. Data are means ± SD; ***p < 0.001 by two-tailed Student’s t test.
(G) Images of corpus callosum of 6-month-old control (Rab35wt/wt;CnpCre/wt) and Rab35 KO (Rab35fl/fl;CnpCre/wt) mice immunostained with antibodies against FTH1 and CC1. Scale bar, 100 μm.
(H) Quantification of integrated density of FTH1 immunostaining within CC1+ cell/area. Data are means ± SD; ns, non-significant; *p < 0.05 by one-way ANOVA with Dunnett’s multiple comparison test.

