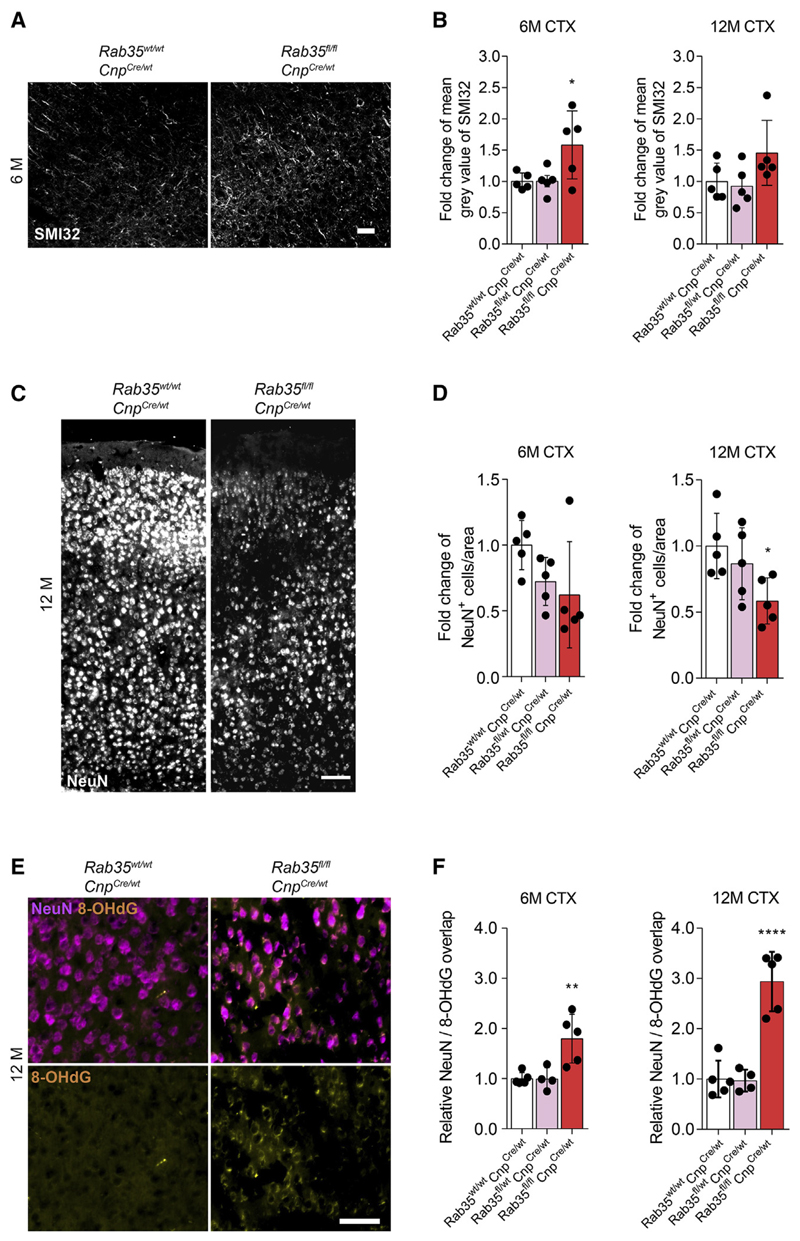
Figure 7. Oligodendrocyte-Specific Rab35 Knockout Results in Neuronal Loss and Oxidative Damage in Mice.
(A) Images of Rab35 KO and control mice cortex immunostained with antibodies against unphosphorylated neurofilament (SMI32). Scale bar, 100 μm.
(B) Quantification of relative change of mean gray value of SMI32 signal of Rab35wt/wt; CnpCre/wt (white), Rab35fl/wt, CnpCre/wt (pink), and Rab35fl/fl;CnpCre/wt (Rab35 KO) mice (red) at 6 and 12 months.
(C) Images of Rab35 KO and control mice cortex immunostained with antibodies against neuronal nuclei (NeuN). Scale bar, 100 μm.
(D) Quantification of relative density of NeuN+ cells/area of 6- and 12-month-old Rab35 KO and control mice motor cortex.
(E) Images of Rab35 KO and control mice motor cortex immunostained with antibodies recognizing oxidative DNA modifications (8-OHdG, yellow), and NeuN (magenta). Scale bar, 50 μm.
(F) Quantification of relative overlap of 8-OHdG and NeuN signals of 6- and 12-month-old Rab35 KO and control mice motor cortex.
In (B), (D), and (F), all data are means ± SD; *p < 0.05, **p < 0.01, ****p < 0.0001 by one-way ANOVA with Tukey’s multiple comparison test.
See also Figures S5–S7.

