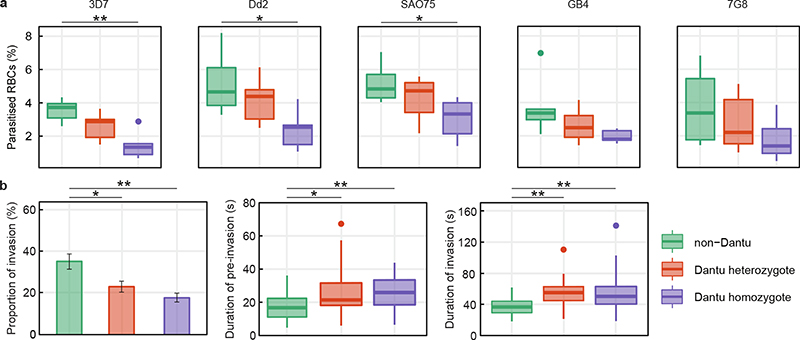
Figure 1. Reduced invasion of Dantu variant RBCs by multiple P. falciparum strains.
(a) The relative ability of P. falciparum strains from multiple geographic locations (3D7 and GB4 West Africa; Dd2 Southeast Asia; SA075 East Africa; 7G8 South America) to invade RBCs was measured using a flow cytometry-based preference invasion assay. The percentage of parasitised RBCs in each genotype group is indicated on the y-axis. Statistical comparison across groups was performed by one-way ANOVA, while pairwise comparisons between groups used the Tukey HSD test. Significant differences in invasion were observed between non-Dantu and Dantu homozygotes in 3D7 (p=0.001), Dd2 (p=0.015) and SAO75 (p=0.028). Statistical data listed in Supplementary Table 2. (b) The invasion process was also followed by live video microscopy, where the invasion rate of 3D7 merozoites was measured as the proportion of merozoites that contacted and successfully invaded RBCs, relative to all merozoites that contacted RBCs. Pre-invasion time - from first merozoite contact through RBC membrane deformation and resting; invasion time - from beginning of merozoite internalization to beginning of echinocytosis. 6 RBCs per genotype group were tested in both flow and video microscopy assays. In the video microscopy assays, the number of contacted and successfully invaded RBCs counted were as follows: non-Dantu: 144/53, Dantu heterozygote: 191/43, Dantu homozygote: 233/41. Boxes indicate the median and interquartile ranges, while whiskers denote the total data range, with the dots outside the whiskers indicating the outliers. Bars show the mean and standard deviation of the video microscopy invasion data. Pairwise comparisons between genotypes were performed using the two-sided Mann-Whitney U test. **p < 0.01; *p < 0.05.

