
Extended Data Fig. 8. PPGNTS neuron activation augments semaglutide-induced eating suppression.
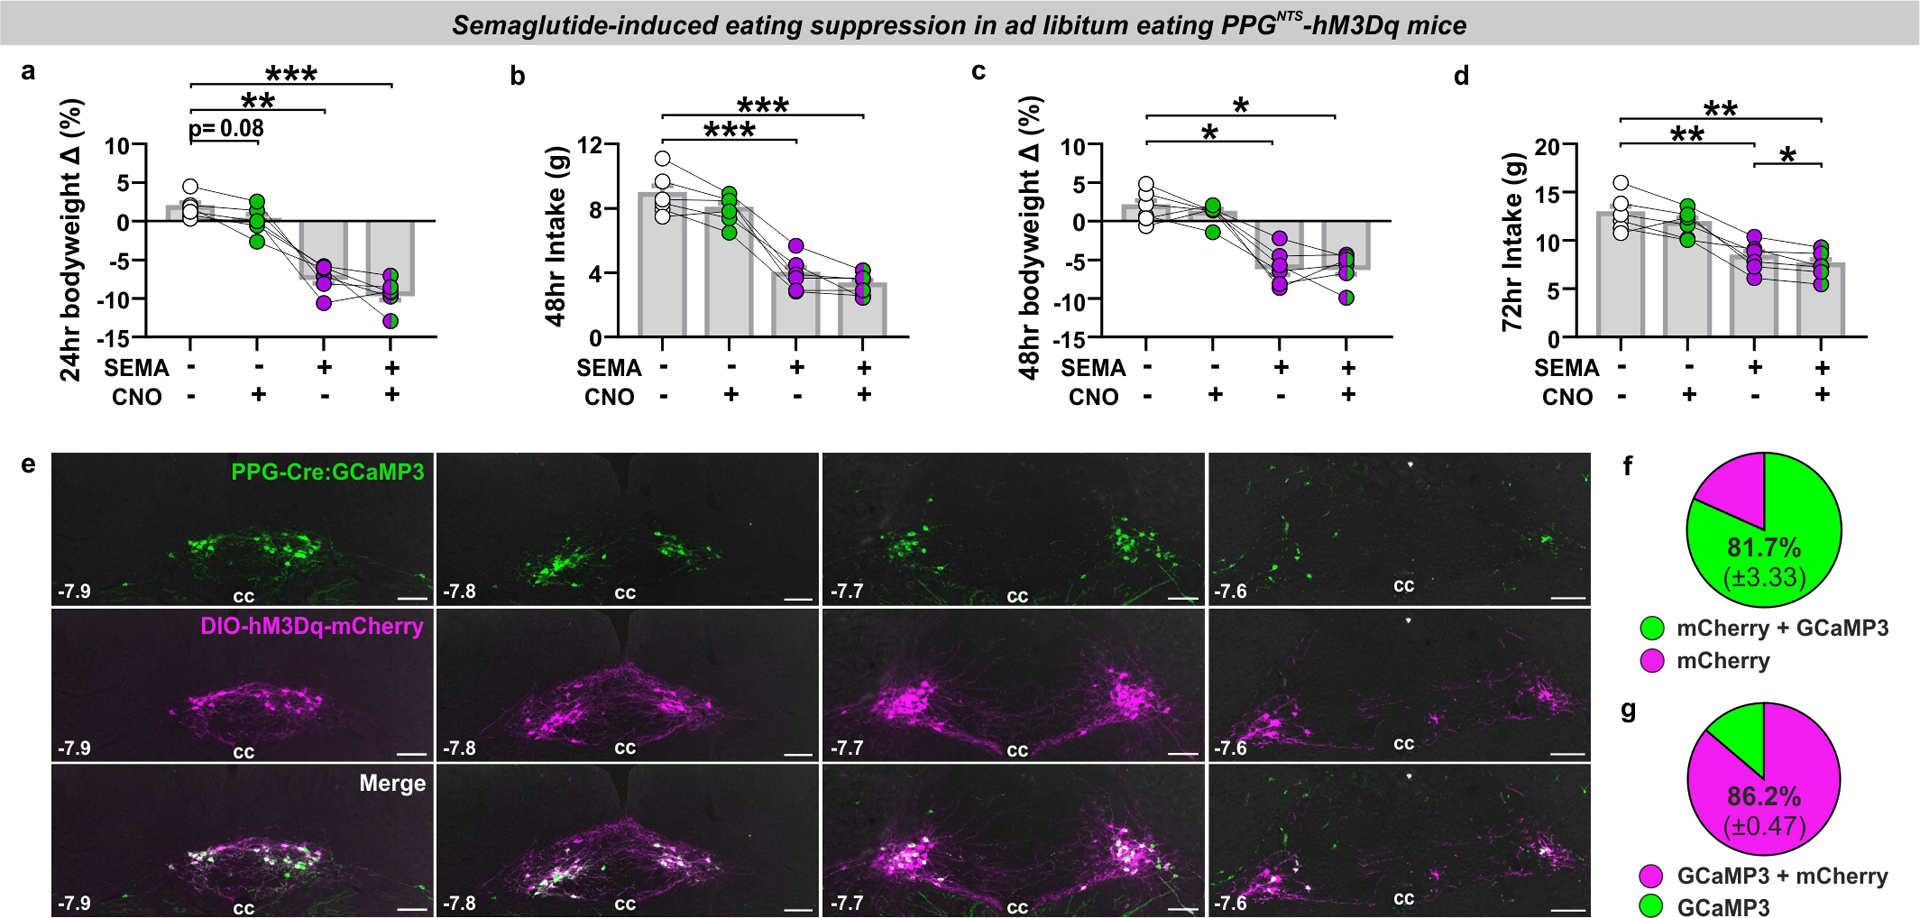
(a-d) Bodyweight change at 24 and 48 hours, and cumulative food intake at 48 and 72 hours (n=6 animals), 1-way within-subjects ANOVA: a) Drug F(2.1,10.5)=61.61, p<0.0001; b) Drug F(2.3,11.3)=102.7, p<0.0001; c) Drug F(2.1,10.6)=24.38, p<0.0001; d) Drug F(1.9,9.3)=40.35, p<0.0001. 72hr BW data not shown: Drug F(2.0,10.2)=4.22, p=0.0454, no significant pairwise comparisons.
(e) Photomicrographs of coronal NTS sections from PPG-Cre:GCaMP3 mice injected with AAV encoding Cre-dependent hM3Dq and mCherry fluorescent reporter (DIO-hM3Dq-mCherry), and co-localisation of the GCaMP3 (amplified by immunostaining against GFP antigen) and mCherry reporters (photomicrographs representative of independent experiments from 4 animals). Distance in mm from Bregma in bottom left, cc: central canal. Scale=100μm.
(f-g) Quantification of viral transduction specificity (f; co-localised cells as % (±SEM) of all mCherry+ cells) and efficiency (g; co-localised cells as % (±SEM) of all GCaMP3+ cells), from a total of 410 mCherry+ cells and 391 GCaMP3+ cells from 4 mice.
All data presented as mean ± SEM.