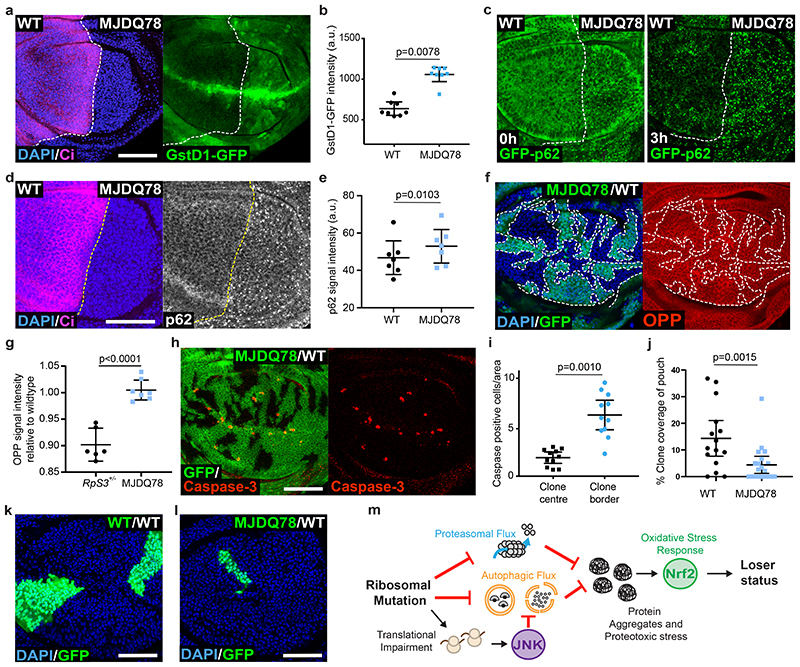
Figure 6. Proteotoxic stress is sufficient to confer the loser status.
(a-b) GstD1-GFP signal (green) in a wing disc expressing MJDQ78 in P cells (labelled by the absence of Ci, magenta) (a) and corresponding quantification (n=8, two-sided Wilcoxon signed-rank test) (b). (c) GFP-p62 ReFlux signal (green) in wing discs expressing MJDQ78 in P cells, immediately after heat shock or three hours later, as indicated. (d-e) p62 staining in a wing disc expressing MJDQ78 in P cells (labelled by the absence of Ci, magenta) (d), and corresponding quantification in (e) (n=7, two-sided paired t-test). (f-g) Wing discs harboring GFP-positive clones expressing MJDQ78 labelled with OPP (red) (f) with corresponding quantification relative to wing discs containing competing RpS3 +/- clones and wildtype winners (image not shown) in (g) (n=6 and 7 respectively, two-sided student’s t-test). (h-i) Mosaic wing disc containing GFP-positive clones overexpressing MJDQ78, immuno-stained for cleaved Caspase-3 (red) (h), and corresponding cell death quantification (n= 11, two-sided Wilcoxon signed-rank test) (i). (j-l) Wing discs harboring wild-type cells and wildtype control clones (GFP-positive) (k) or clones expressing MJDQ78 (GFP-positive) (l), and corresponding quantification (n=15 and 20 respectively, two-sided Mann-Whitney U test) (j). (m) Model summarizing how ribosome gene loss leads to proteotoxic stress and to the loser status. For all micrographs, scale bars correspond to 50μm. For all quantifications provided, the horizontal line represents the mean and whiskers indicate 95% confidence intervals. All n numbers refer to the number of individual wing discs.

