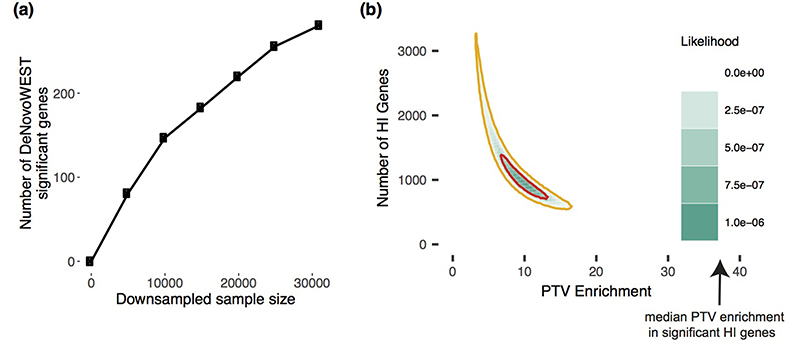
Extended Data Figure 1. Exploring the remaining number of DD genes.
(a) Number of significant genes from downsampling full cohort and running DeNovoWEST’s enrichment test. (b) Results from modelling the likelihood of the observed distribution of de novo PTV mutations. This model varies the numbers of remaining haploinsufficient (HI) DD genes and PTV enrichment in those remaining genes. The 50% credible interval is shown in red and the 90% credible interval is shown in orange. Note that the median PTV enrichment in genes that are significant and known to operate via a loss-of-function mechanism (shown with an arrow) is 39.7.

