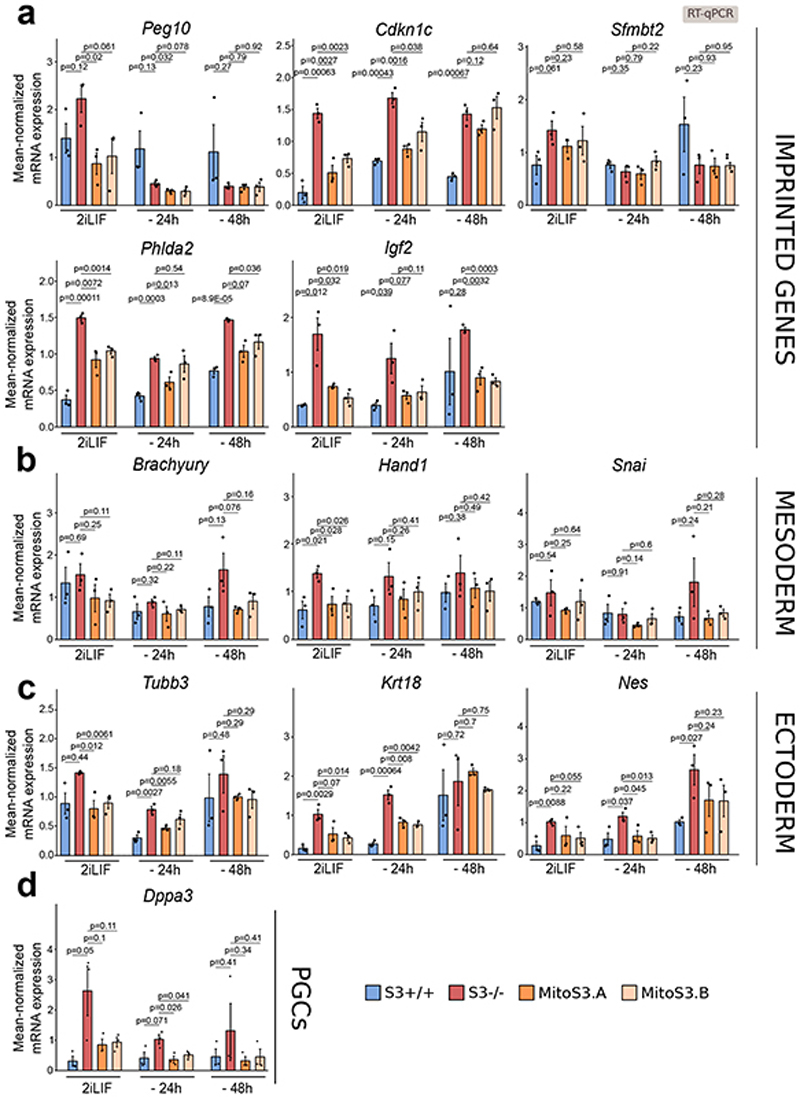
Extended Data Fig. 6. Mitochondrial Stat3 slows down ESC differentiation.
Gene expression analysis by RT–qPCR of S3+/+, S3-/- and MitoS3.A/B clones cultured with 2iLIF or without 2iLIF for 24h or 48h. Data show expression of Imprinted genes a, Mesoderm b, Ectoderm c, and PGCs d, markers that are more readily induced in S3-/- and MitoS3.A/B clones rescues this effect. Beta-actin served as an internal control. Bars indicate mean ±s.e.m. of n=3 independent experiments, shown as dots. Two-tailed unpaired T-test relative to S3-/- for each time point.

