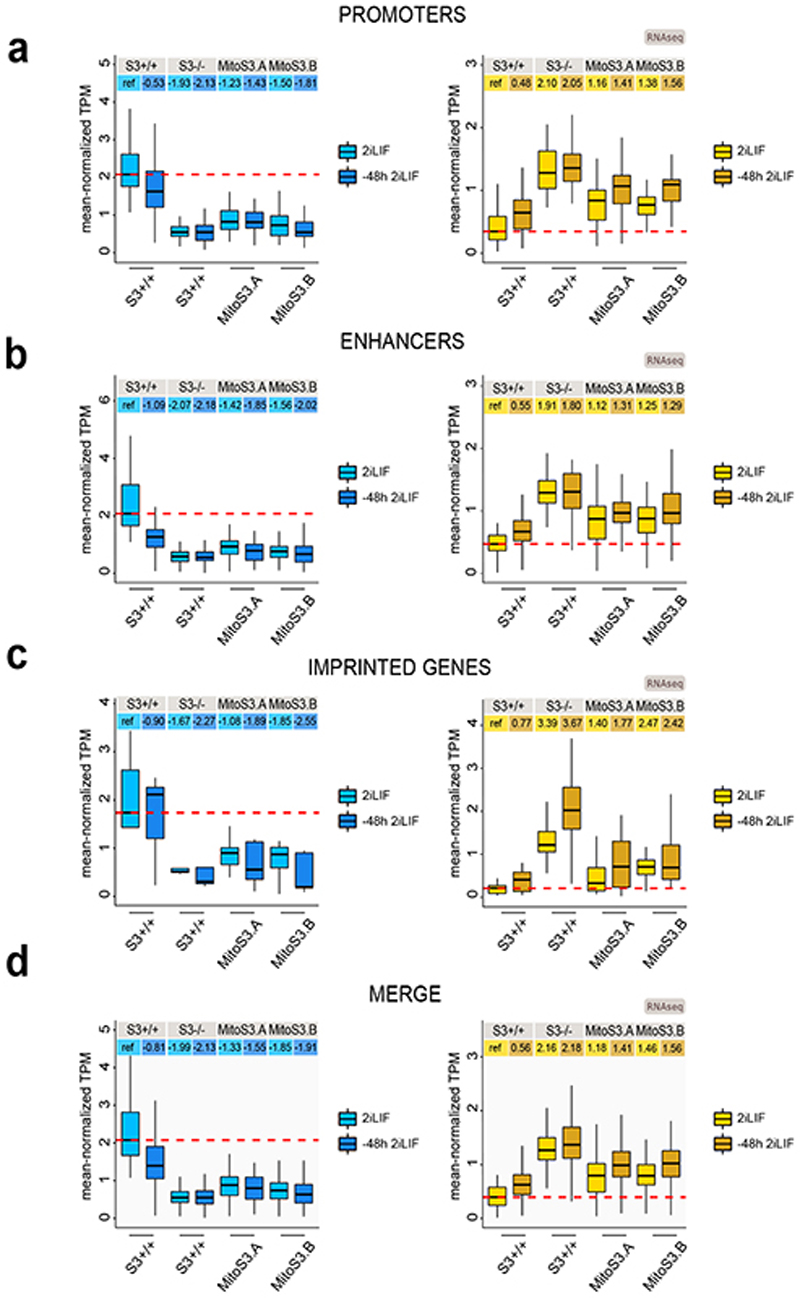
Extended Data Fig. 7. Stat3 regulates transcripts associated to differentially methylated genomic features.
a, Left: boxplot reporting expression levels of genes down-regulated in S3-/- cells relative to S3+/+ cells (Fig. 7a, blue dots) and differentially methylated at promoter regions (Fig. 2b). Right: boxplot reporting expression levels of genes up-regulated in S3-/- cells with respect to S3+/+ cells (Fig. 7a, yellow dots) and with differential methylation at promoter regions (Fig. 2b). Each boxplot shows 1st, 2nd and 3rd quartile. Whiskers shows minimum and maximum values. Y axis represents mean-normalized TPM values for S3+/+, S3-/- and MitoS3.A and MitoS3.B) in two different conditions: following stable culturing of cells in 2iLIF (light color) and after 48h of 2iLIF withdrawal from culture medium (dark color).
b, Boxplot reporting expression levels of genes down-regulated (left) or up-regulated (right) in S3-/- cells relative to S3+/+ cells and differentially methylated at enhancer regions (Fig. 2c), as described above.
c, Boxplot reporting expression levels of genes down-regulated (left) or up-regulated (right) in S3-/- cells relative to S3+/+ cells and differentially methylated at the associated DMR (Fig. 2f), as described above.
d, Merge of genes contained in boxplots shown in Extended Data Fig. 7a,b,c.

