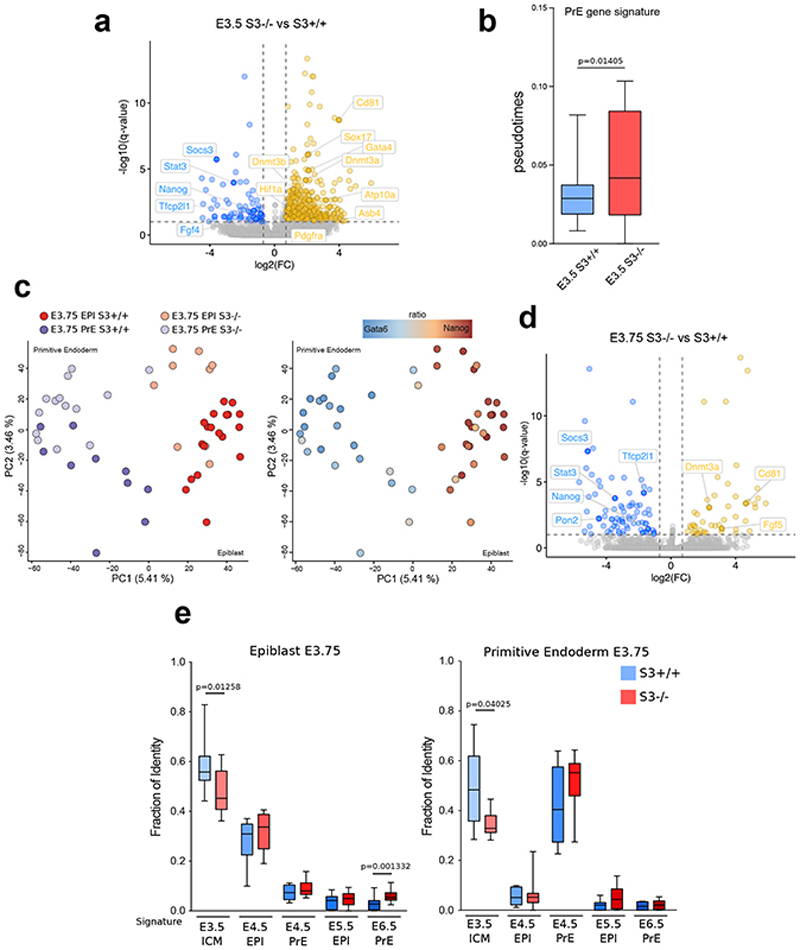
Extended Data Fig. 8. Accelerated progression of Stat3 null embryos.
a, Volcano plot of genes differentially expressed between S3-/- and S3+/+ cells at E3.5. Red and blue dots indicate respectively transcripts that are upregulated or downregulated (log2 FC > 0.7 or FC < -0.7 respectively, q-value < 0.1) in S3-/- cells relative to S3+/+ cells.
b, Diffusion pseudotime of E3.5 cells and the PrE gene signature computed with R package “destiny “ (http://bioinformatics.oxfordjournals.org/content/32/8/1241) using all the expressed genes as input list. P-value calculated with two-tailed Mann-Whitney test.
c, PCA plot computed with all the expressed genes. Colors represent different lineages/genotypes (left panel) or ratio between Gata6 and Nanog expression (right panel).
d, Volcano plot of genes differentially expressed between S3-/- and S3+/+ cells at E3.75. Red and blue dots indicate respectively transcripts that are upregulated or downregulated (log2 FC > 0.7 or FC < - 0.7 respectively, q-value < 0.1) in S3-/- cells relative to S3+/+ cells.
e, Fraction of identity between E3.75 EPI(left panel)/PrE(right panel) and E3.5 ICM, E4.5 EPI, E4.5 PrE, E5.5 EPI and E6.5 EPI stages computed with all the expressed genes. P-value calculated with two-tailed Mann-Whitney test.
All boxplot shows 1st, 2nd and 3rd quartile. Whiskers show minimum and maximum values.

