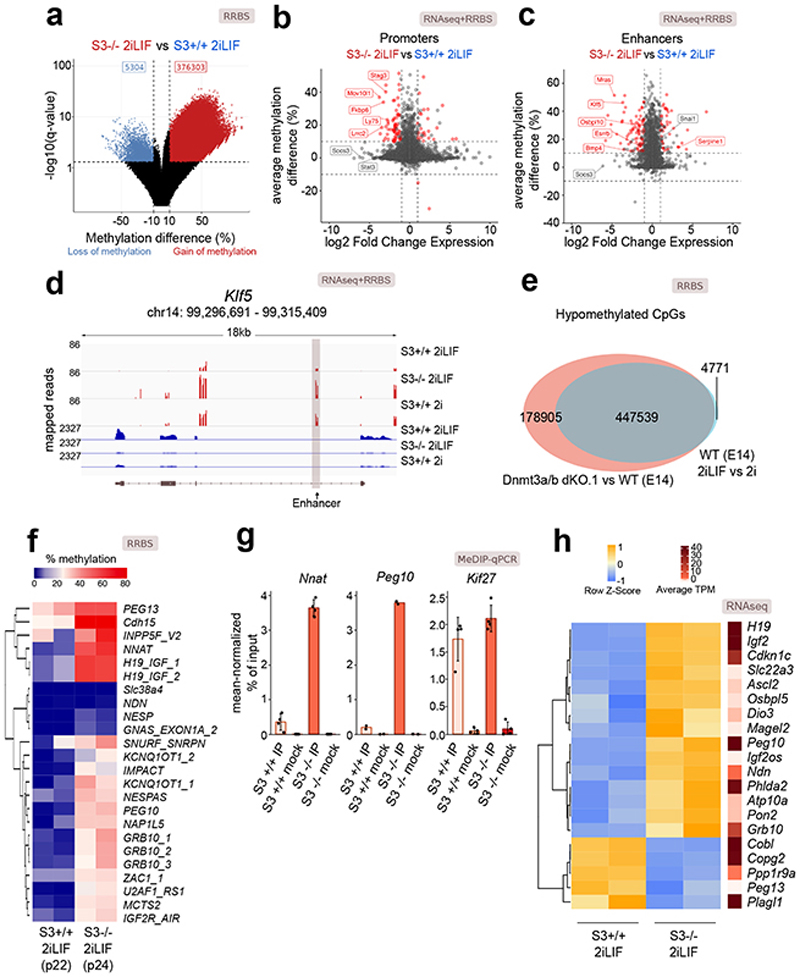
Fig. 2. Impact of Stat3 on DNA methylation and transcription.
a, Volcano plot showing the significant differentially methylated CpG sites (q-value < 0.01, difference > 10% or < -10%) between S3-/- and S3+/+ cells.
b and c, Scatter plot showing changes in expression and DNA methylation at active promoters (b) or enhancers (c) between S3+/+ and S3-/- cells. Red dots: genes for which both changes were statistically significant (q-value < 0.01). See Supplementary Table 2.
d, Gene tracks showing RRBS and RNA-seq data for S3+/+ 2iLIF, S3+/+ 2i and S3-/- 2iLIF cells over the Klf5 genomic region. One representative biological replicate out of two is shown.
e, Venn diagram of CpG sites whose methylation status is dependent on either LIF (light blue) or on Dnmt3a/b (red) or on both (gray intersection).
f, Percentage of DNA methylation at imprinted DMRs. n = 2 biological replicates for each sample. See Supplementary Table 2.
g, MeDIP-qPCR of DMRs and a control region (Kif27). Mock immunoprecipitations with a non-specific IgG antibody served as negative controls. Mean ±S.D. of n = 4 (Nnat, Kif27) or mean of n = 2 (Peg10) experiments, shown as dots.
h, Heatmap showing relative and absolute expression of imprinted genes associated to known DMRs (Fig. 2f) and differentially expressed between S3-/- and S3+/+ cells. Relative expression shown as z-scores of scaled values; absolute expression indicated on the right as average transcripts per million (TPM) values. n = 2 biological replicates for each sample.
All P values calculated by two-tailed unpaired t-test.

