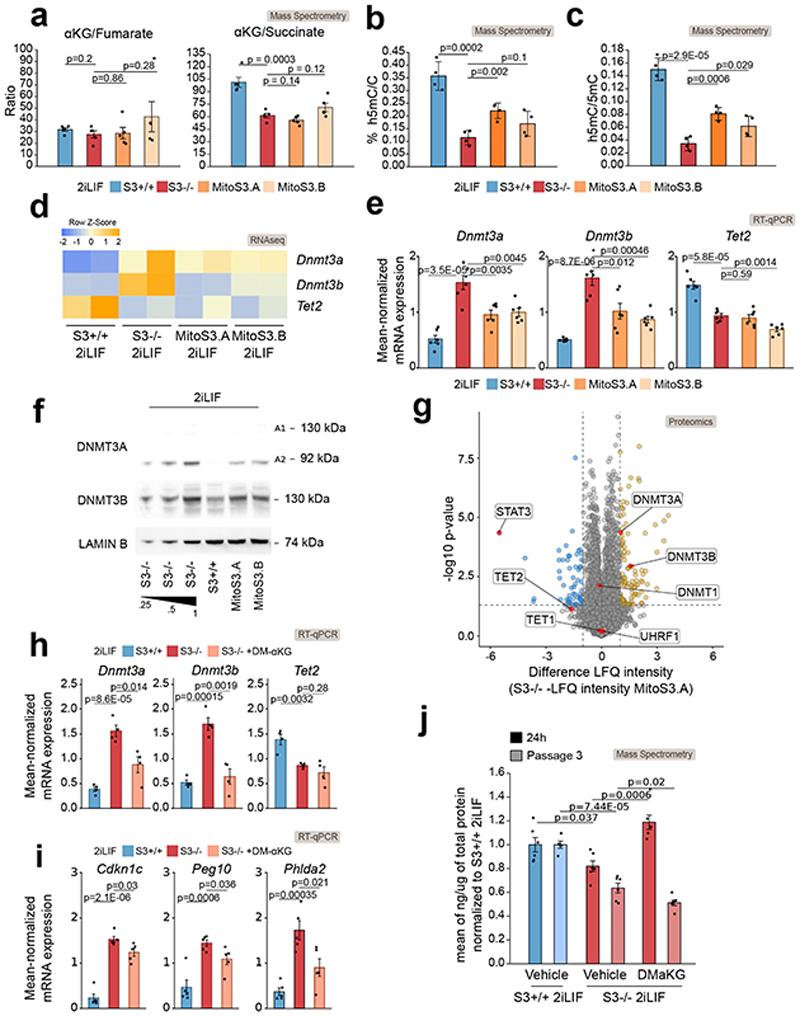
Fig. 5. Alpha-ketoglutarate regulates 5mC mainly via control of Dnmt3a/b levels.
a-g, S3+/+, S3-/- cells and two MitoS3.A/B clones, cultured in 2iLIF, were analyzed.
a, αKG/fumarate and αKG/succinate ratios measured by mass spectrometry. Bars: mean ±s.e.m. of 5 biological replicates, shown as dots.
b, Percentages of h5mC. Bars: mean ±s.e.m. of 4 biological replicates, shown as dots.
c, h5mC/5mC ratio. Bars: mean ±s.e.m. of 5 biological replicates, shown as dots.
d-e, Expression analysis of enzymes controlling DNA methylation by RNA-seq (d) and qPCR (e).
d, Heatmap shows z-scores from scaled RNA-seq expression values. n= 2 biological replicates.
e, Bars: mean ±s.e.m. of n = 6 experiments, shown as dots.
f, Western blot for Dnmt3a, Dnmt3b and Lamin B, used as a loading control. Representative images of n = 2 independent experiments.
g, Proteomic analysis. Yellow and blue dots indicate proteins that are more or less abundant (difference > 1 or < -1 respectively, P value < 0.05) in S3-/- relative to MitoS3.A cells. n = 5 biological replicates. Source data in Supplementary Table 3.
h-i, Gene expression analysis of epigenetic modifiers (h) and imprinted genes (i) in S3+/+, S3-/- and S3-/- cells cultured in 2iLIF and treated with 2 mM DM-αKG for 4 passages. Bars: mean ±s.e.m. of n = 4 experiments, shown as dots.
j, Quantification of intracellular αKG abundance in S3+/+ cells and in S3-/- cells treated with vehicle or 2 mM DM- αKG for 24 h (dark bars) or for 3 passages (light bars). Bars: mean ±s.e.m. of n = 6 biological replicates, shown as dots.
All P values calculated using two-tailed unpaired t-test.

