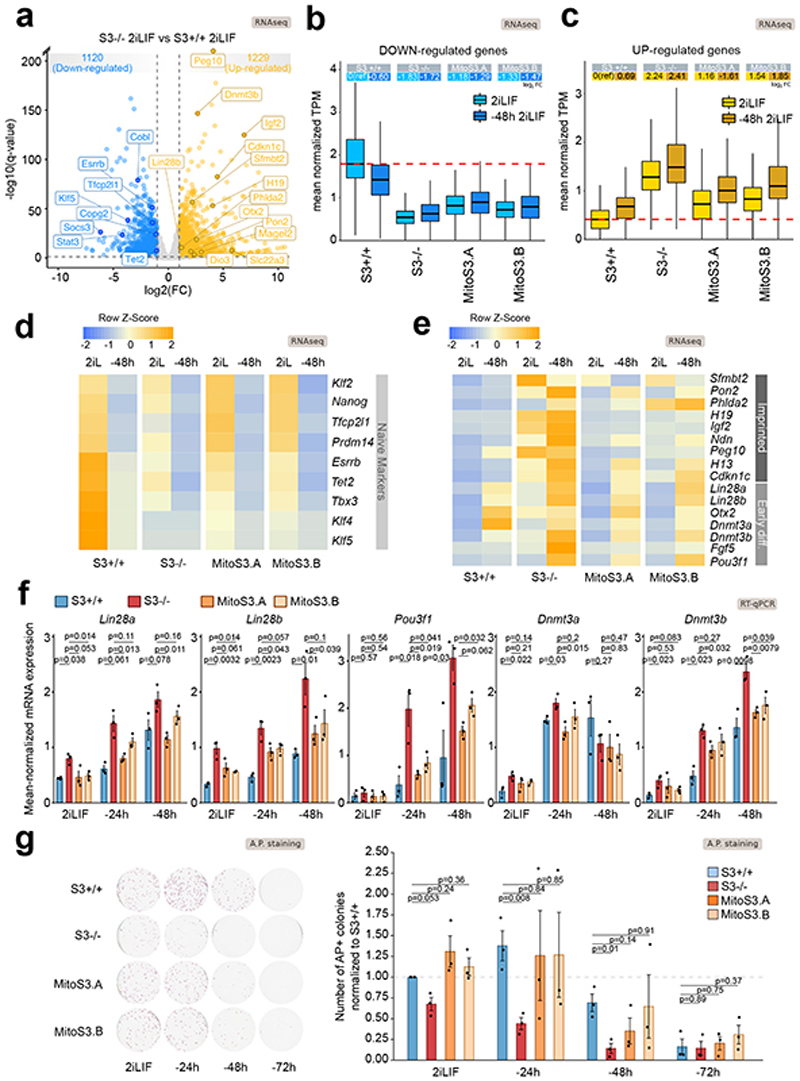
Fig. 7. Mitochondrial Stat3 regulates ESC differentiation.
a, Volcano plot showing differentially expressed genes (log2 FC > 1 or < -1, q-value < 0.01, Benjamini-Hochberg adjustment) between S3+/+ and S3-/- cells. n = 2 biological replicates.
b-c, Boxplot reporting expression levels of downregulated (b) or upregulated (c) genes in S3-/- cells relative to S3+/+ cells. Each boxplot shows 1st, 2nd and 3rd quartile. Whiskers show minimum and maximum values. Cells were either analyzed in 2iLIF (light blue) and after 48 h of 2iLIF withdrawal (”-48h“). Upper table shows mean log2 FC relative to S3+/+ 2iLIF.
d-e, Heatmap of makers of naive pluripotency, early differentiation and imprinted genes. Expression levels were scaled and represented as z-score. n = 2 biological replicates.
f, Gene expression analysis by RT–qPCR of S3+/+ (blue), S3-/- (red) and two MitoS3.A/B (orange) clones cultured in 2iLIF or without 2iLIF for 24 h or 48 h (“-24h “ or “-48h “). Bars: mean ±s.e.m. of n = 3 experiments, shown as dots. P values calculated using two-tailed unpaired t-test relative to S3-/-. See Extended Data Figure 6.
g, Alkaline phosphatase (AP) staining in S3+/+, S3-/- and MitoS3.A/B clones cultured with 2iLIF or without 2iLIF for 24 h, 48 h or 72 h. Representative images and quantification of AP-positive colonies, relative to S3+/+ cells in 2iLIF. Mean ±s.e.m. of n = 3 experiments is shown. P values calculated using two-tailed unpaired t-test.

