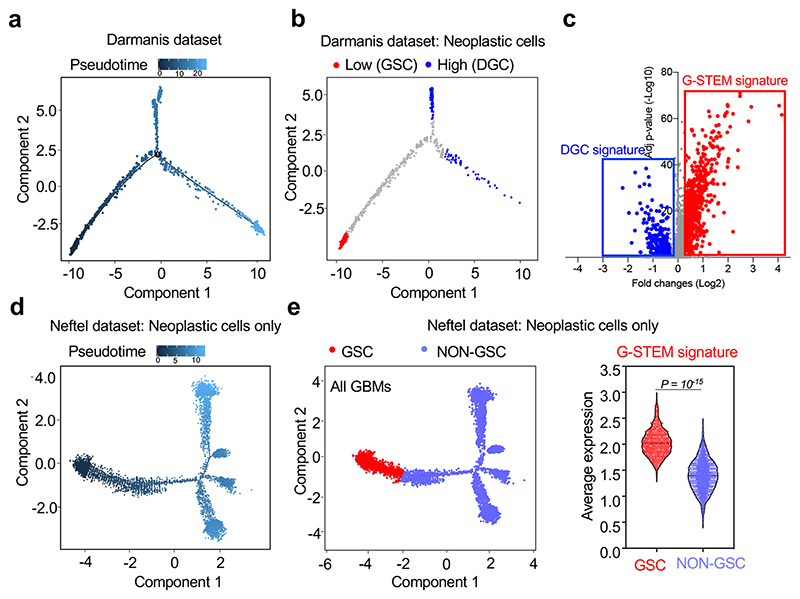
Fig. 1. A gene expression program identifying native GSCs.
(a) Single-cell differentiation trajectory of GBM cells reconstructed by Monocle2 using single-cell RNA-seq data from primary GBM samples of the Darmanis dataset, using the cell populations indicated in Extended Data Fig. 1a.
(b) Single-cell differentiation trajectory of the GBM cells of the Darmanis dataset hilighting the putative GSC and DGC cell populations, identified as neoplastic cell populations displaying Low (< first quartile) or High (> third quartile) pseudotime values, respectively.
(c) Volcano plot of the gene expression changes between the GSC and DGC populations of the Darmanis dataset, with indicated the genes composing the G-STEM and the DGC signatures.
(d) Single-cell trajectory of GBM cells reconstructed by Monocle2 using single-cell RNA-seq data from the sole neoplastic cells of primary GBM samples of the Neftel dataset.
(e) Violin plots showing the expression of the G-STEM signature (right panel) on the cells at the start of the pseudotime trajectory of the Neftel dataset (GSC; red dots in the left panel) vs. all the other neoplastic cells (NON GSC; light blue dots in the left panel). The p-value was determined by two-tailed Mann-Whitney test.

