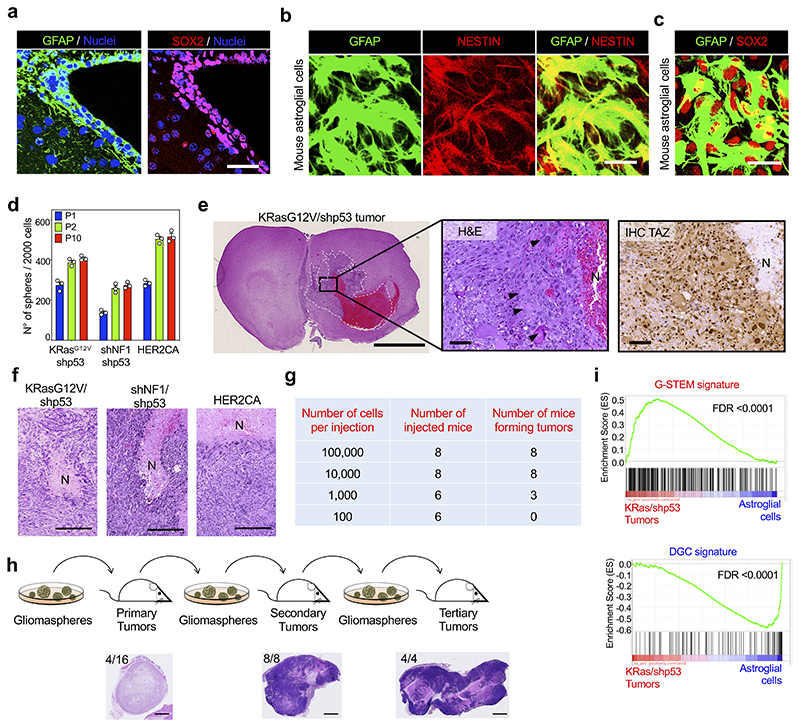
Extended Data Fig. 7. Ex-vivo reprogramming of normal neural cells into GSC-like cells.
(a) GFAP and SOX2 stainings (scale bars, 50 μm) of the mouse SVZ, representative of n=3 mice. Nuclei were counterstained with DAPI.
(b, c) GFAP, NESTIN and SOX2 stainings (scale bars, 50 μm) in mouse newborn astroglial cells, representative of two independent experiments.
(d) Gliomaspheres emerging from newborn astroglial cell cultures transformed by the indicated oncogenes (P0 spheres) were dissociated to single cells and replated at clonal density for gliomasphere formation (P1 to P10 spheres). Results are representative of three experiments with n=3 replicates each. Data are presented as scatter dot plots and bar graphs showing mean with s.d.
(e) Left panel: H&E staining of a lesion obtained after intracranial transplantation of shNf1/shp53-transformed astroglial cells. N, necrotic area. Scale bar, 2.5 mm. Middle panel: High magnification of the same tumor, showing large polynucleated cells (arrowheads). Right panel: TAZ IHC on the same tumor. Scale bars, 100 μm. Experiments were independently repeated on n=10 mice, with similar results.
(f) H E staining of subcutaneous tumors obtained by injecting cells dissociated from gliomaspheres carrying the indicated oncogenic lesions, representative of: KRasG12V/shp53, n=4 tumors; HER2CA, n=6 tumors; shNf1/shp53, n=5 tumors. N, necrotic areas. Scale bars, 250 μm.
(g) Number of mice displaying tumor formation after injection of cells dissociated from KRasG12V/shp53-gliomaspheres at the indicated cell dilutions.
(h) Top, Schematic representation of the serial transplantation assay performed with HER2CA-transformed cells (see Methods for details). Bottom, H&E staining (scale bars, 2.5 mm) of tumors obtained after each round of transplantation, representative of n=4 primary tumors, n=8 secondary tumors and n=4 tertiary tumors, respectively. Numbers of mice developing tumors per numbers of transplanted mice are indicated in each picture.
(i) GSEA curves of the G-STEM and the DGC signatures in KRasG12V/shp53-tumors compared to the astroglial cells from which they derive. Signatures are available in Supplementary Table 7.

