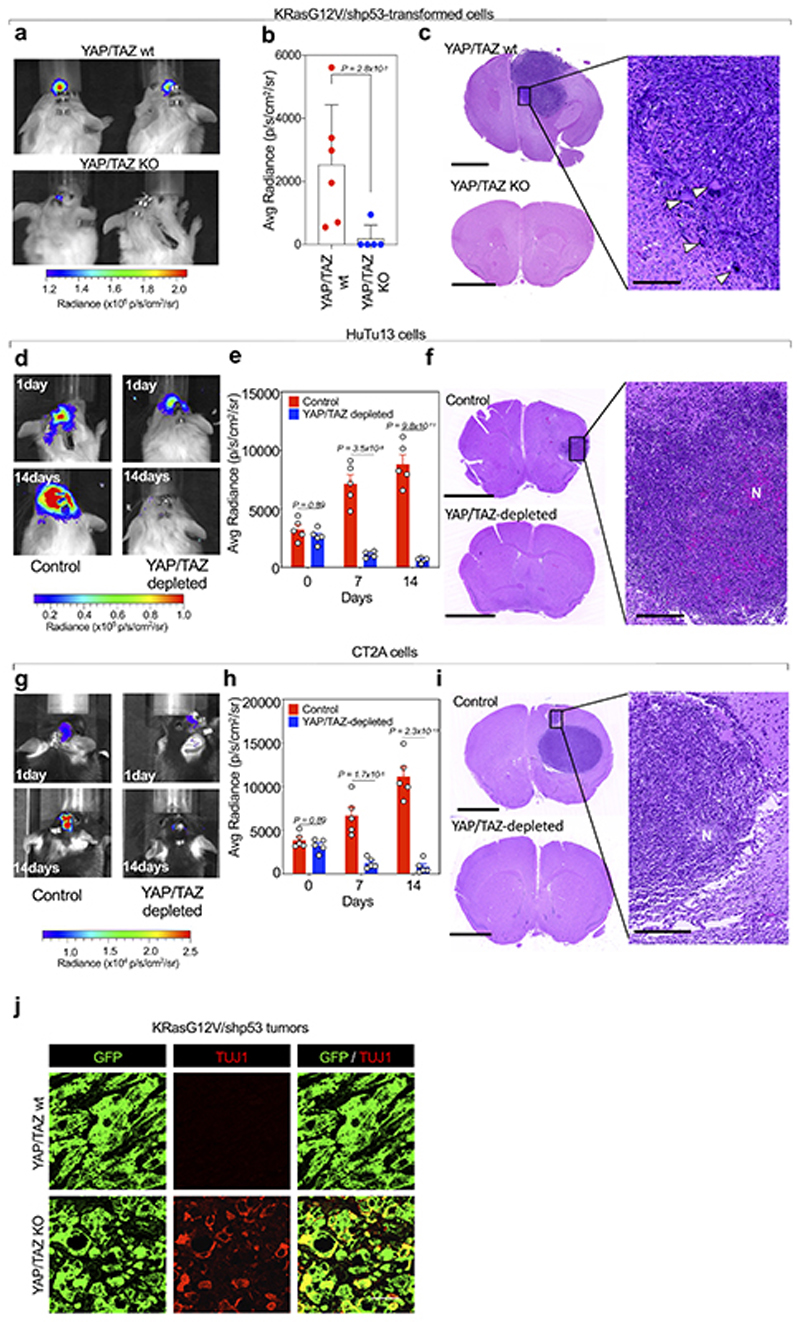
Extended Data Fig. 10. YAP/TAZ are required for GBM initiation in vivo.
(a-c) Immunocompromised mice were injected intracranially with KRasG12V/shp53-transformed Yapfl/fl;Tazfl/fl cells, also transduced with dual luciferase-GFP expression vectors. Control animals (n=6) were injected with cells transduced with Ad-GFP, whereas YAP/TAZ KO animals (n=5) were injected with cells transduced with Ad-Cre. (a) Representative images of brain bioluminescence. (b) Bioluminescence quantification shown as scatter dot plots and bar graphs showing mean with s.d; p-value was calculated by unpaired two-tailed t-test. (c) Representative H&E stainings. Scale bars, 2.5 mm in left panels and 250 μm in the magnification shown on the right. Arrowheads highlight the presence of large, polynucleated cells.
(d-f) Immunocompromised mice were injected intracranially with HuTu13 cells transduced with dual luciferase-GFP expression vectors, and transfected with siCo (Control; n=5) or siYAP/TAZ (YAP/TAZ depleted; n=5). (d) Representative images of brain bioluminescence. (e) Bioluminescence quantification shown as scatter dot plots and bar graphs showing mean with s.d.; unpaired two-tailed t-test p-values are shown. (f) Representative H&E stainings. Scale bars, 2.5 mm in left panels and 250 μm in the magnification shown on the right. ‘N’ indicates necrosis.
(g-i) CT2A cells were transduced with dual luciferase-GFP expression vectors and injected intracranially in syngeneic mice. Control animals (n=5) were injected with cells expressing anti-GFP shRNA, whereas YAP/TAZ-depleted animals (n=5) were injected with cells expressing doxycycline-inducible YAP and TAZ shRNAs. (g) Representative brain bioluminescences at one day and 14 days after injection. (h) Bioluminescence quantification at three different time points shown as scatter dot plots and bar graphs showing mean with s.d.; unpaired two-tailed t-test p-values are shown. (i) Representative H&E stainings. Scale bars, 2.5 mm in left panels and 250 μm in the magnification shown on the right. N, necrotic areas.
(j) GFP and TUJ1 stainings in sections from YAP/TAZ-wt and YAP/TAZ-KO subcutaneous shNF1/shp53-induced tumors (representative of n=3 independent samples each). Scale bars, 50 μm.

