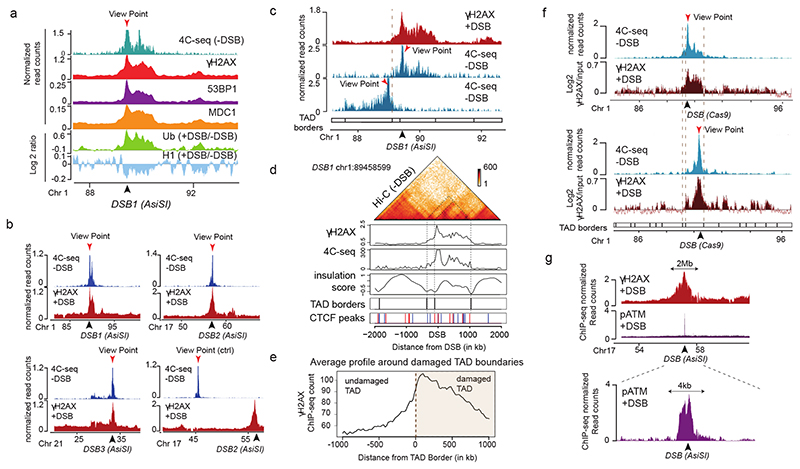
Figure 1. TADs are functional units governing DDR chromatin domains establishment.
(a) 4C-seq track in undamaged cells (-DSB) and ChIP-seq tracks of histone H1 (H1.2) and Ubiquitin (FK2) (log2 (+DSB/-DSB)) as well as γH2AX, MDC1 and 53BP1 (+DSB) as indicated. ChIP-seq data were smoothed using 50kb span, 4C-seq using a 10kb span. The AsiSI site is indicated by an arrow. (b) 4C-seq before DSB induction (-DSB) and γH2AX ChIP-seq after DSB induction (+DSB) tracks (smoothed using a 50kb span) for different viewpoints localized at three AsiSI sites or a Control region. One representative experiment is shown (out of n=3). Arrows: AsiSI sites. (c) γH2AX ChIP-seq (+DSB) and 4C-seq (-DSB) tracks (10 kb smoothed) for two viewpoints localized at the AsiSI site or 470 kb upstream of the AsiSI site. Viewpoints: red arrows, DSB: black arrows. (d) Hi-C contact matrix of a region of the chromosome 1 in DIvA cells before DSB induction (top panel). γH2AX ChIP-seq after DSB induction, 4C-seq signal, TAD borders computed from Hi-C data and CTCF ChIP-seq peaks position before DSB induction are shown. Peaks in blue contain a CTCF motif in the forward orientation and peaks in red a CTCF motif in the reverse orientation. (e) Average profile of γH2AX ChIP-seq after DSB induction centered on the closest TAD border to the 174 best-induced DSBs (damaged TAD on the right). (f) 4C-seq track (10 kb smoothed) before DSB induction (-DSB) (in blue) using view points as indicated (red arrows). γH2AX ChIP-chip tracks (log2 sample/input, smoothed using 500 probes span) after DSB induction with CRISPR/Cas9 (black arrows) are shown in red. (g) γH2AX and pATM (S1981) ChIP-seq tracks after DSB induction (+DSB) on an 8 Mb window (top panel) and a 15 kb window (bottom panel) around an AsiSI site (black arrow).

