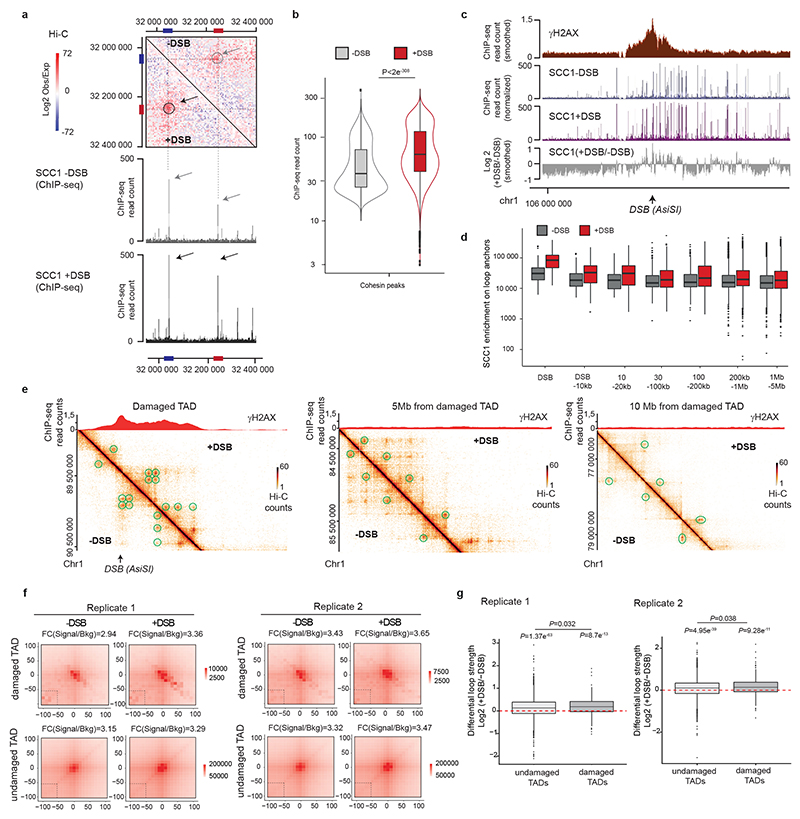
Extended Data Figure 6. Increased genome-wide, DSB-induced, cohesin binding is enhanced within damaged TADs.
(a) Upper panel: Contact matrix (5kb resolution) showing the log2 (observed/expected) before or after DSB induction as indicated, on a region showing a loop on chromosome 20 and devoid of AsiSI site (no DSB). Loops anchors are circled and indicated by red and blue bars. Lower panel: Genome browser screenshot showing the SCC1 calibrated ChIP-seq on the same region before and after DSB induction as indicated. Cohesin enrichment at the loop anchors (blue and red bars) is increased after DSB (black arrows) compared to before DSB (grey arrows) in agreement with an increased loop strength (grey and black circles). (b) Violin plots showing the SCC1 enrichment at cohesin peaks (n=46194) before and after DSB induction as indicated. P values are indicated (paired one-sided Wilcoxon test). (c) Genomic tracks of γH2AX (red) and SCC1 ChIP-seq signal before (blue) and after (purple) DSB 862 induction. The ratio between before and after DSB induction (grey) is also shown (expressed 863 as the log2 +DSB/-DSB) (10kb smoothed). (d) Boxplot showing the quantification of SCC1 864 recruitment on loop anchors, at different distances from DSB sites as indicated (from left to 865 right, n=1610, 3161, 1930, 3232, 4786, 25263, 114461). Center line: median; Box limits: 1st and 3rd quartiles; Whiskers: Maximum and minimum; points: outliers. (e) γH2AX ChIP-seq signal and Hi-C signal at different distances from a damaged TAD of the chromosome 1 before (-DSB) and after DSB induction (+DSB). Green circles represent the chromatin loops. (f) Aggregate Peak Analysis (APA) plot on a 200 kb window (10 kb resolution) before (-DSB) and after DSB induction (+DSB) calculated for all loop anchors, in damaged and undamaged TAD as indicated. The fold change between the signal (central pixel) and the background (lower left corner 5x5 pixels) is indicated. (g) Boxplots showing the differential loops strength in undamaged or damaged TADs as indicated (see methods), computed from Hi-C data obtained before and after DSB, from replicate #1 (left panel) ad replicate #2 (right panel). P values between before and after DSB are indicated (Wilcoxon 876 test, μ=0). The increased loop strength following DSB is significantly higher in damaged TADs as compared to undamaged TADs (paired two-sided Wilcoxon test) in both Hi-C replicates experiments. Replicate #1: undamaged n=2936; damaged n=264. Replicate #2, undamaged n=3181, damaged n=302. Center line: median; Box limits: 1st and 3rd quartiles; Whiskers: Maximum and minimum without outliers; Points: outliers.

