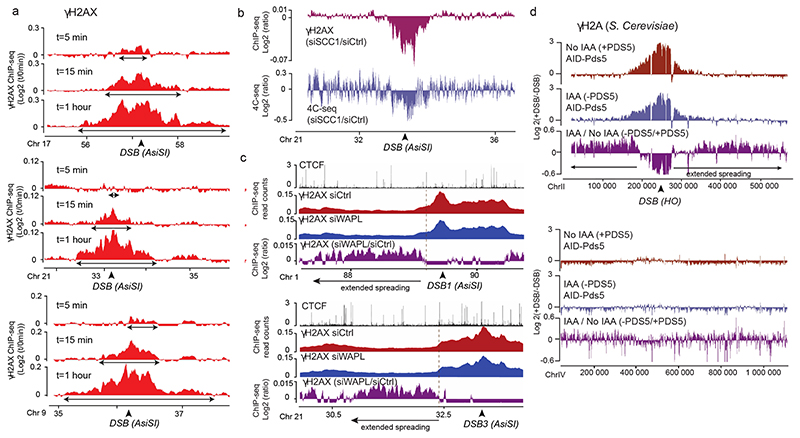
Figure 3. DSB-anchored loop extrusion mediates γH2AX spreading.
(a) γH2AX ChIP-seq tracks at three DSB sites upon DSB induction at different time points after ATMi release (expressed as log2 (+DSB+ATMi+time after washes/ +DSB+ATMi+0min after washes)) (20 kb smoothed). (b) Genomic track showing differential (log2 ratio siSCC1/ siCtrl) γH2AX enrichment obtained after DSB induction (purple) (20kb smoothed). Light blue track shows the differential 4C-seq signal obtained in SCC1-depleted versus control cells before DSB induction (log2 siSCC1/siCtrl). (c) Genomic tracks showing the CTCF signal before DSB induction, the γH2AX ChIP-seq signal after DSB induction in Ctrl or WAPL-depleted cells and the differential γH2AX signal obtained after DSB induction (expressed as the log2 ratio siWAPL/siCtrl, 20kb smoothed) at two DSB sites. (d) Genomic tracks showing the differential γH2A ChIP-seq signal (log2 +DSB/-DSB) before (no IAA) or after PDS5 degradation (IAA) at one DSB site (HO site) (top panel) and in a control region (without DSB) (bottom panel) in S.Cerevisiae PDS5-AID. The differential signal between after and before PDS5 degradation (IAA / No IAA) is also shown (purple). Data are smoothed with a 2kb span.

