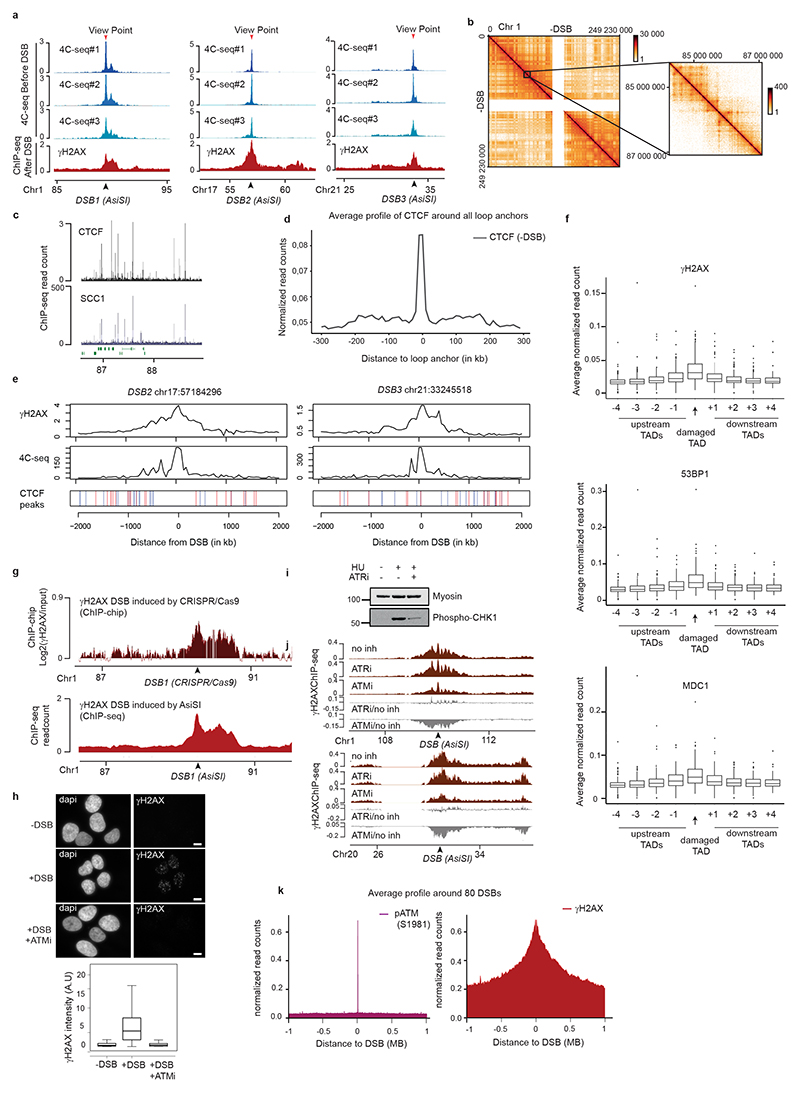
Extended Data Figure 1. γH2AX spreads within prior TAD as revealed by 4C-seq.
(a) 4C-seq tracks before DSB induction obtained for three independent biological replicates and γH2AX ChIP-seq track after DSB induction for different viewpoints (red arrows) localized at three AsiSI sites (black arrows). ChIP-seq data are smoothed using 100 kb span, 4C-seq using a 50 kb span. (b) Example of the Hi-C pattern obtained on chromosome 1 at a 500kb resolution (left) together with a magnification at a 10kb resolution (right). (c) CTCF and calibrated-SCC1 ChIP-seq tracks. (d) Average profile of CTCF ChIP-seq around all loop anchors on the genome (determined using this Hi-C dataset, see Methods), validating both CTCF ChIP-seq and Hi-C datasets. (e) γH2AX ChIP-seq after DSB induction, 4C-seq and CTCF ChIP-seq peak position before DSB induction are shown (peaks in blue contain a CTCF motif in the forward orientation and peaks in red a CTCF motif in the reverse orientation). (f) Box plot showing γH2AX (top), 53BP1 (middle) and MDC1 (bottom) ChIP-seq quantification within the damaged TAD and neighboring TADs for the best cleaved DSBs in DIvA cells (see methods). Center line: median; Box limits: 1st and 3rd quartiles; Whiskers: Maximum and minimum without outliers; Points: outliers. (n=153). (g) γH2AX tracks around a DSB induced by CRISPR/Cas9 (upper panel, ChIP-chip, expressed as the log2 sample/input, smoothed using 100 probes windows) and by AsiSI at the same position (lower panel, ChIP-seq, 50kb smoothed). (h) Top: Immunofluorescence experiment showing γH2AX and DAPI staining before and after DSB induction with or without ATM inhibitor as indicated (scale bar, 10μm). Bottom: Quantification of γH2AX intensity (expressed in A.U: Arbitrary Unit) in the above conditions. One representative experiment is shown (out of n=3 biological replicates. Center line: median; Box limits: 1st and 3rd quartiles; Whiskers: Maximum and minimum without outliers; Points: outliers. (−DSB n=117 nuclei; +DSB n=97 nuclei; +DSB+ATMi n=95 nuclei) (i) Validation of the ATR inhibitor efficiency: Western Blot showing the effect of ATRi on the phosphorylation of CHK1 following a treatment with hydroxyurea (HU) (n=2). For gel source data, see Supplementary Figure 1. (j) γH2AX ChIP-seq tracks after DSB induction in untreated cells or in cells treated with an inhibitor of ATM or ATR at two DSB sites (20kb smoothed). The differential γH2AX signal obtained after DSB induction (expressed as the log2 ratio ATMi/untreated or ATRi/untreated, grey tracks) is also shown. (k) Average profile of pATM (S1981) (left panel) and γH2AX (right panel) ChIP-seq on a 2 Mb window around the eighty best-cleaved DSBs in DIvA cells.

