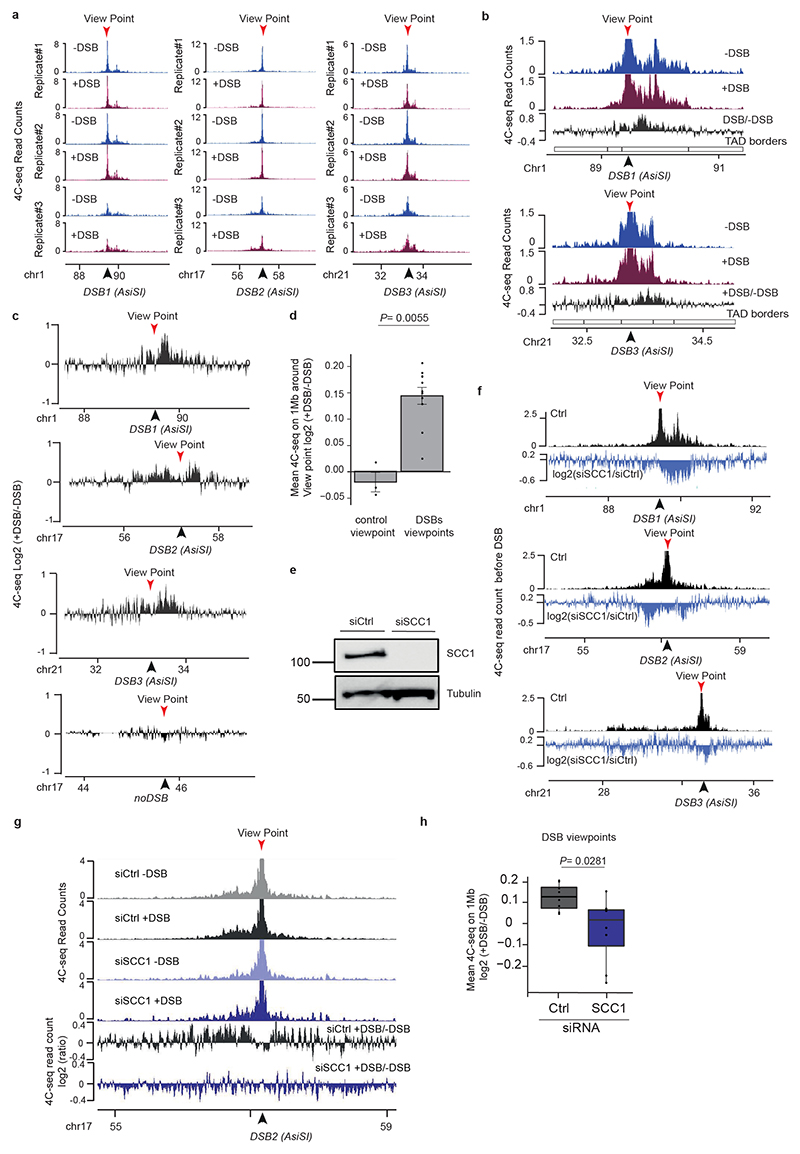
Extended Data Figure 3. Loop extrusion at DSBs detected by 4C-seq.
(a) 4C-seq tracks (10 kb smoothed) before and after DSB induction as indicated, obtained for three biological replicates using viewpoints localized at three DSB sites. The DSBs are indicated by arrows. (b) 4C-seq tracks before (blue) and after (purple) DSB induction, at two DSB viewpoints. Differential 4C-seq (Log2 +DSB/-DSB) is also shown (black). (c) Differential 4C-seq (log2 +DSB/-DSB) is shown for three viewpoints located at DSB sites and on a Ctrl region as indicated. (d) Bar plot showing the differential 4C-seq signal (log2 +DSB/-DSB) computed on 1 Mb around four independent viewpoints located at DSBs (“DSBs viewpoints”, n=11) and one control region (“Control viewpoint”, n=3), across four independent biological experiments (see Methods). P value between control and DSBs viewpoints is indicated (two-sided Wilcoxon test). S.e.m and mean values are plotted. (e) Western Blot showing the depletion of SCC1 by siRNA (n=3). For gel source data, see Supplementary Figure 1. (f) Differential (log2) 4C-seq track in SCC1 siRNA treated cells versus control siRNA-treated cells (in undamaged conditions) for three viewpoints. (g) Genomics tracks showing the 4C-seq signals before and after DSB induction in siRNA Ctrl-or SCC1-treated cells and the differential 4C-seq signal in Ctrl or SCC1 siRNA treated cells (log2 +DSB/-DSB) (10kb smoothed). (h) Boxplot showing the average Log2 +DSB/-DSB 4C-seq, on 1 Mb around four DSBs viewpoints (two biological experiments) upon control or SCC1 depletion by siRNA (see Methods) (n=8). P value: two-sided Wilcoxon test. Center line: median; Box limits: 1st and 3rd quartiles; Whiskers: Maximum and minimum without outliers.

