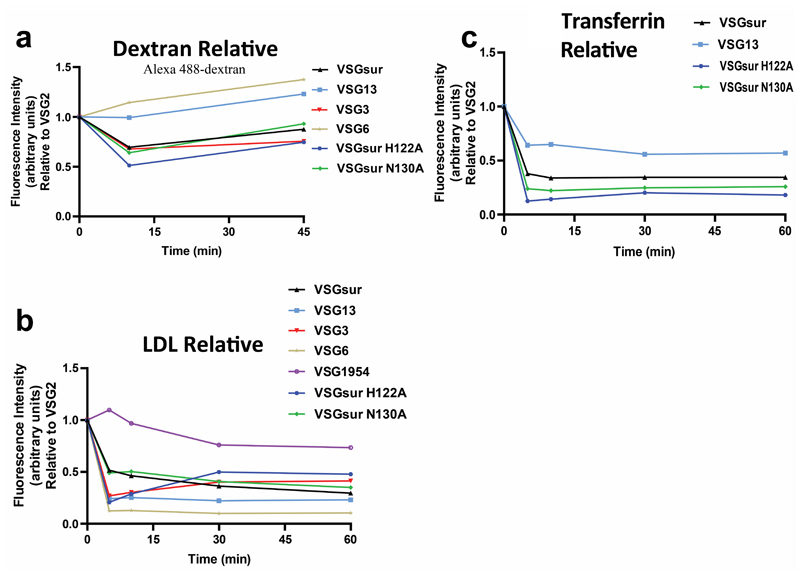
Extended Data Fig. 10. Endocytosis rates by different VSGs relative to VSG2.
Alexa 488-dextran (a), bodipy-LDL (b), and Alexa 488-transferrin (c) endocytosis by T. b. brucei 2T1 cells expressing a variety of different VSG genes. Due to technical limitations, each cell line could not be analyzed simultaneously within each experiment for each ligand. Therefore, VSG2 was used as a control in all experiments, allowing the calculation of each cell line’s relative uptake rate of each ligand as compared to the uptake rate of each ligand observed by VSG2 expressing cells within each separate experiment. Each of these graphs therefore represent the combined experimental results from 2 separate experiments. Cell lines with a relative fluorescence intensity below 1 at a given time point have less efficient endocytic rates compared to VSG2 expressing cells, and vice versa. All graphs share the same Y axis.

