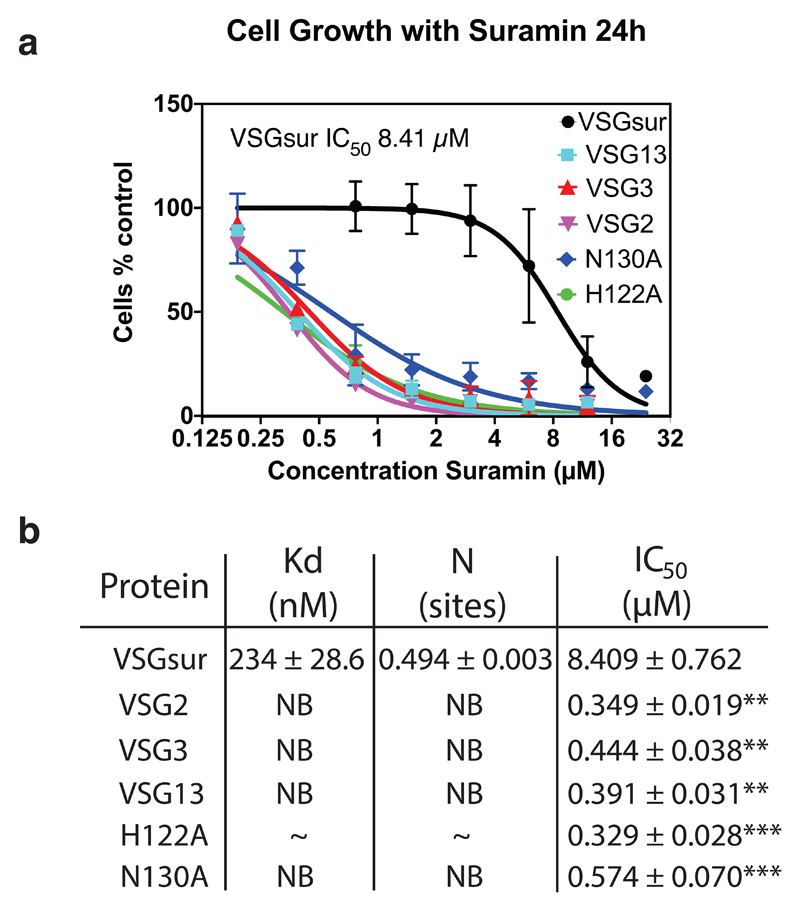
Fig. 2. Suramin Binds only VSGsur and is more toxic to all other VSGs examined.
(a) Growth curves of different VSGsur expressing strains at different suramin concentrations. The IC50 value was calculated for each curve (with independent experiments numbering three for VSG13, VSG3, and VSG2, four for VSGsur, and five for VSGsur mutants H122A and N130A) using a least squares, non-linear fit (Graphpad Prism, inhibitor concentration vs. normalized response with variable slope and the error bars showing the standard deviation of the mean). P < .0001 with the null hypothesis that there is no significant difference between any of the IC50 values, indicating extremely significant differences (alpha = 0.05, F(DFn, DFd = 169.3 (5, 129)). (b) Isothermal calorimetric results of suramin binding to different VSGs. “NB” indicates no binding. “~” for the VSGsur H122A mutant indicates evidence of weak binding, but a satisfactory fit to the curve could not be made (Extended Data Fig. 3). The binding for H122A is expected to be in the high μM range. ITC runs were performed with aliquots from the same samples run several times, independently. Details on the ITC measurements are in Extended Data Fig 5. For the IC50 values listed in the third column of the table, significance tests were made between VSGsur and the other VSGs using an unpaired two-tailed t-test (**P<.01 and ***P<.001; VSGsur vs. VSG13, P value=0.0044, VSGsur vs. VSG2, P value=0.0043, VSGsur vs. VSG3, P value=0.0046, VSGsur vs H122A, P value=0.0003, VSGsur vs. N130A, P value=0.0004). The error measurement for the IC50 values is the standard deviation of the mean.

