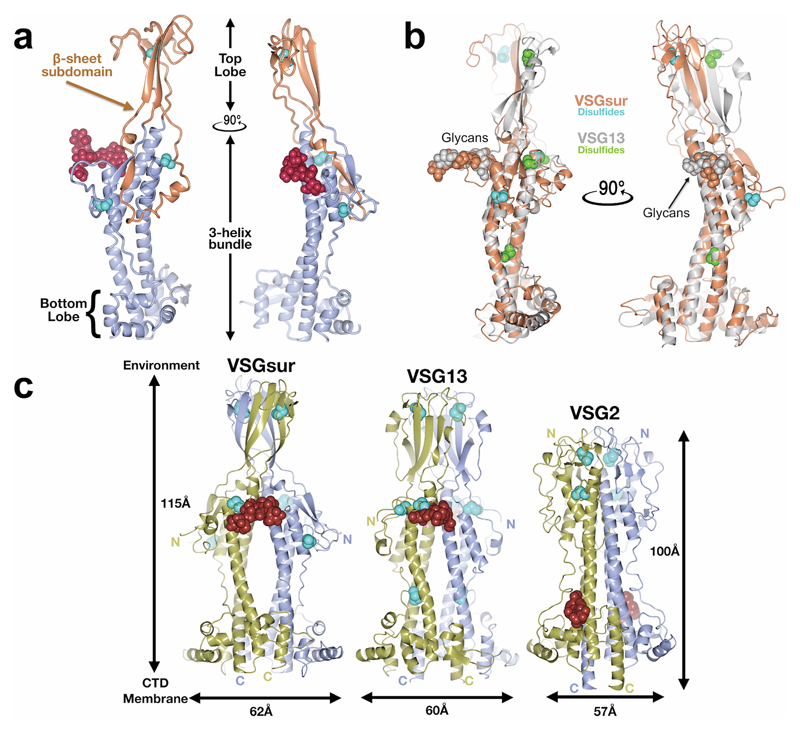
Extended Data Fig. 1. Comparison of the VSG NTDs.
(a) A single monomer of the VSGsur NTD is shown as a ribbon diagram. The β-sheet subdomain that forms the top lobe is colored in orange and the rest of the structure in beige. The N-linked glycan is shown as red space-filling spheres, the cysteine disulfide atoms as space-filling cyan spheres. (b) Structural alignment of monomers of VSGsur (orange) and VSG13 (gray) with corresponding glycans and disulfides shown in space filling representation and colored the same as the protein to which they are linked. The alignment produces an overall root-mean-square deviation of 1Å for the conserved portions of the structure (calculated over 220 Cα positions that primarily encompass the three-helix bundle and elements of the bottom lobe). (c) Comparison of the structures of VSGsur, VSG13, and VSG2. The N-linked glycans are displayed as red space-filling atoms and the disulfide bonds are shown in cyan. Approximate dimensions of the molecules are noted, as well as the directions toward the external environment and toward the C-terminal domain (CTD) and plasma membrane of the trypanosome.

