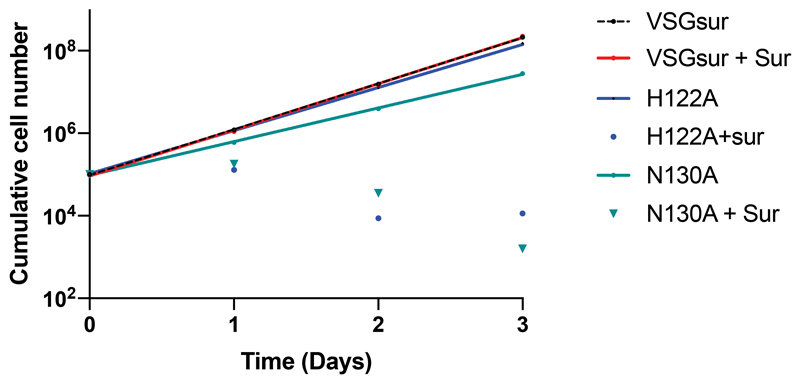
Extended Data Fig. 2. Growth curves of VSGsur and VSG mutants.
Strains expressing VSGsur and VSGsur mutants were grown with and without suramin (incubation of 0.7μM suramin for 24 h, Methods). The cell densities were determined by cell counting using a Neubauer hemocytometer. This procedure was repeated for 3-4 days in a row. Analysis was performed with GraphPad Prism, using a nonlinear regression model for curve fitting (Exponential growth with log). For statistical comparisons, we tested whether the slopes and intercepts of the best fit curves were significantly different. For VSGsur and VSGsur + 0.7μM suramin, the differences between the slopes is not significant (P value = 0.7720). For H122A and N130A (without suramin) compared to VSGsur the differences are significant (P<.0113 and P<.0001, respectively). Two independent experiments with different cultures were made for each data point.

