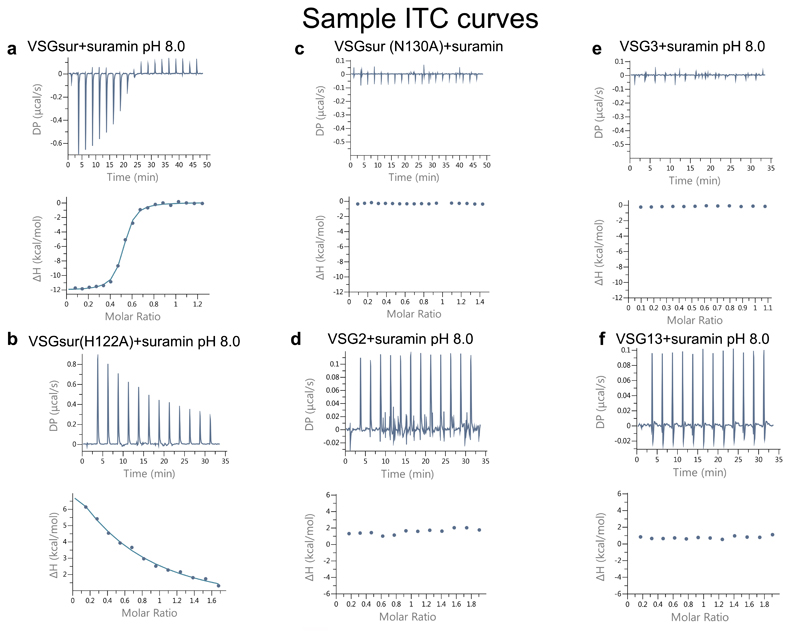
Extended Data Fig. 3. Sample ITC results.
ITC data for suramin binding to each VSG protein. The upper panels contain the baseline corrected raw data, and the lower panel contains the peak-integrated, concentration normalized data for the heat of reaction vs. molar ratio of suramin per VSG protein. (a) VSGSur was measured 3 times, independently: 300μM suramin was titrated into 46μM VSGsur, the curve fitted with a single binding site model to calculate a Kd of 234+/- 28 nM and N of 0.49 +/- 0.03 (b) VSGSur H122A was measured 3 times, independently: 450μM suramin was titrated into 51.1μM VSGSur H122A. A Kd could not be fit to the data, although it is clear that the mutation negatively affected the binding affinity. (c) VSGSur N130A was measured 2 times, independently: 300μM suramin was titrated into 40μM VSGSur N130A. No binding was detected. (d) VSG2 was measured 2 times, independently: 200μM Suramin was titrated into 20μM VSG2 protein. No binding was detected. (e) VSG3 was measured 2 times, independently: 300μM suramin was titrated into 53.1μM VSG3. No binding was detected. (f) VSG13 was measured 2 times, independently: 200μM Suramin was titrated into 20μM VSG132 protein. No binding was detected.

