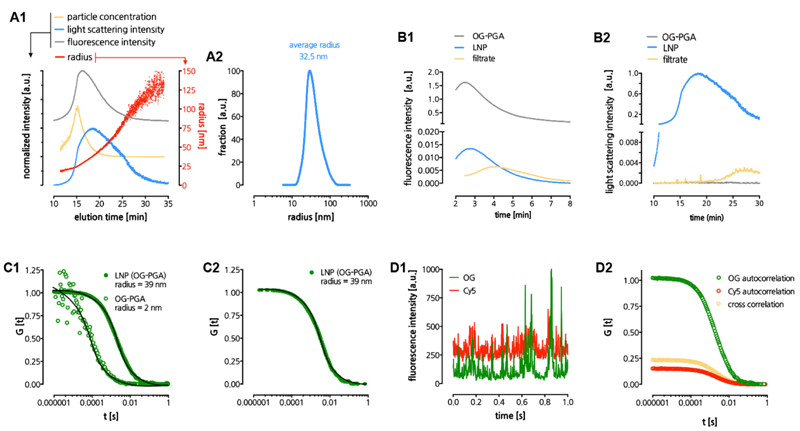
Figure 3. Physicochemical characterization of LNP.
(A) Asymmetric field flow fractionation (AFFF) analysis of LNP. Panel A1 depicts multiple parameters as function of the elution time, panel A2 depicts the calculated size distribution based on the light scattering signal. (B) AFFF analysis used to determine encapsulation of OG-PGA in LNP. Panel B1 depicts the fluorescence signal in the time interval where OG-PGA elutes. Panel B2 depicts the light scattering signal in the time interval where the LNP elute. (C) LNP analysis by fluorescence correlation spectroscopy (FCS). Panel C1 depicts normalized autocorrelation curves (evaluated from measuring fluorescence fluctuations in the OG(-PGA) signal) and their fits (solid lines) that yielded the radii of PGA and LNP in aqueous medium. Panel C2 depicts normalized autocorrelation curves (calculated from measuring fluorescence fluctuations in the OG(-PGA) signal) and the corresponding fit (solid line) yielding the radius of LNP in human blood plasma. Panel C3 depicts time fluorescence fluctuations (time traces) of the OG(-PGA) and Cy5(-DOPE) signals. Panel C4 depicts auto- and cross-correlation curves the OG(-PGA) and Cy5(-DOPE) signals from LNP in aqueous medium.

