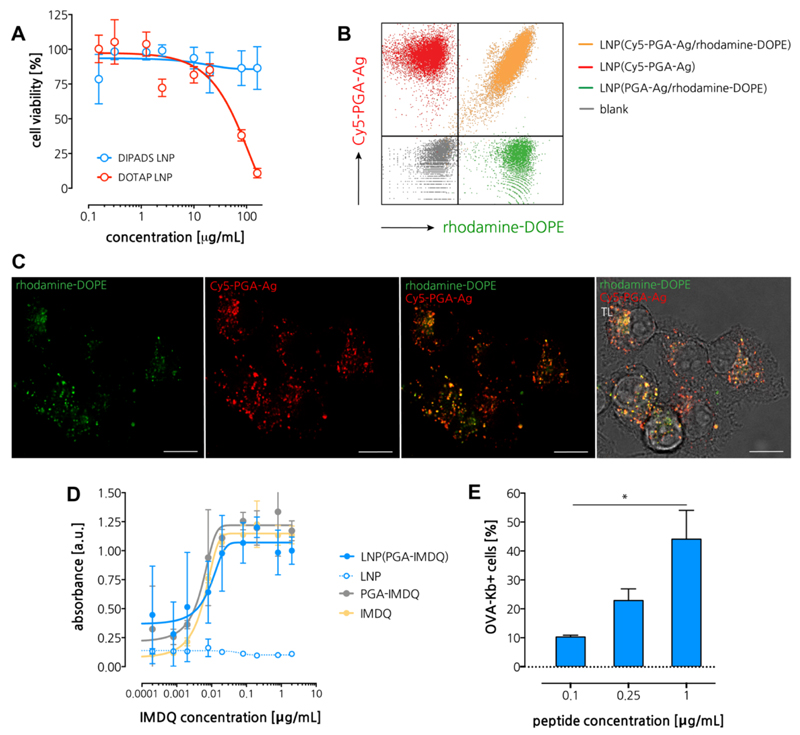
Figure 4. In vitro immuno-biological characterization of LNP.
(A) Cell viability measured by MTT assay. (n=6) (B) Flow cytometry analysis if DC2.4 cells pulsed with single-dye or double-dye labeled LNP. (C) Confocal microscopy of DC2.4 cells pulsed with LNP. Scale bar represents 15 microns. (D) Dose-response innate activation measured by the RAW Blue reporter cell assay (n=3). (E) Flow cytometry analysis of DC2.4 cells pulsed with different concentration of antigen loaded LNP followed by immunostaining with the OVA-Kb antibody (n=3; t-test *: p<0.05).

