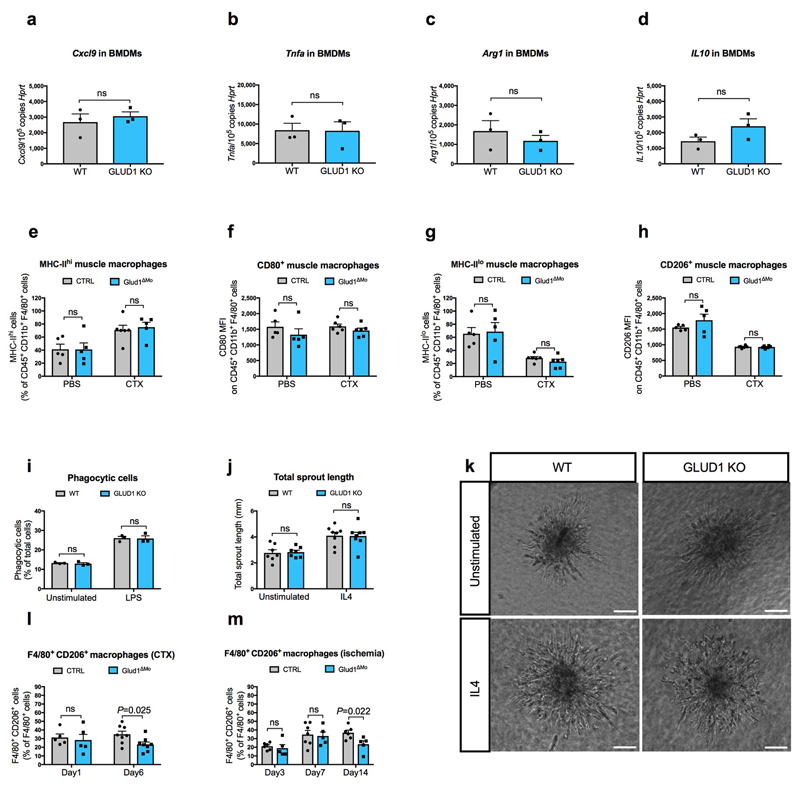
Extended Data Figure 3. GLUD1 loss in macrophages does not alter either M1/M2 polarization or their related functions.
a-d, RT-qPCR of Cxcl9 (a), Tnfa (b), Arg1 (c), and Il10 (d) in BMDMs isolated from CTRL and Glud1ΔMo mice (n=3).
e-h, FACS analysis of different M1 (e, f) or M2 (g, h) polarization states in CD45+ CD11b+ F4/80+ macrophages isolated from TA muscles at baseline (n=5) or 1 day post-CTX (n=6).
i, Quantification of macrophage phagocytosis. BMDMs were treated with LPS or PBS (unstimulated) prior to the assay (n=3).
j,k, Quantification (j), and representative images (k) of total endothelial sprout length of spheroid containing HUVEC and WT or Glud1ΔMo BMDMs. BMDMs were treated with IL4 prior to the assay; unstimulated BMDMs were used as control (Unstimulated n=7; IL4 n=8).
l-m, CD206+ F4/80+ area in TA muscles 1 day (n=5) and 6 days (n=8) post-CTX (l) or in crural muscles 3 days (CTRL n=6; Glud1ΔMo n=5), 7 days (CTRL n=7; Glud1ΔMo n=5) and 14 days (CTRL n=6; Glud1ΔMo n=5) post-ligation (m).
All experiments show representative values of at least 2 independent experiments. Unpaired two-tailed t-test was everywhere applied; ns, not significant (P>0.05). Scale bars: 50 μm (k). Graphs show mean ± SEM.

