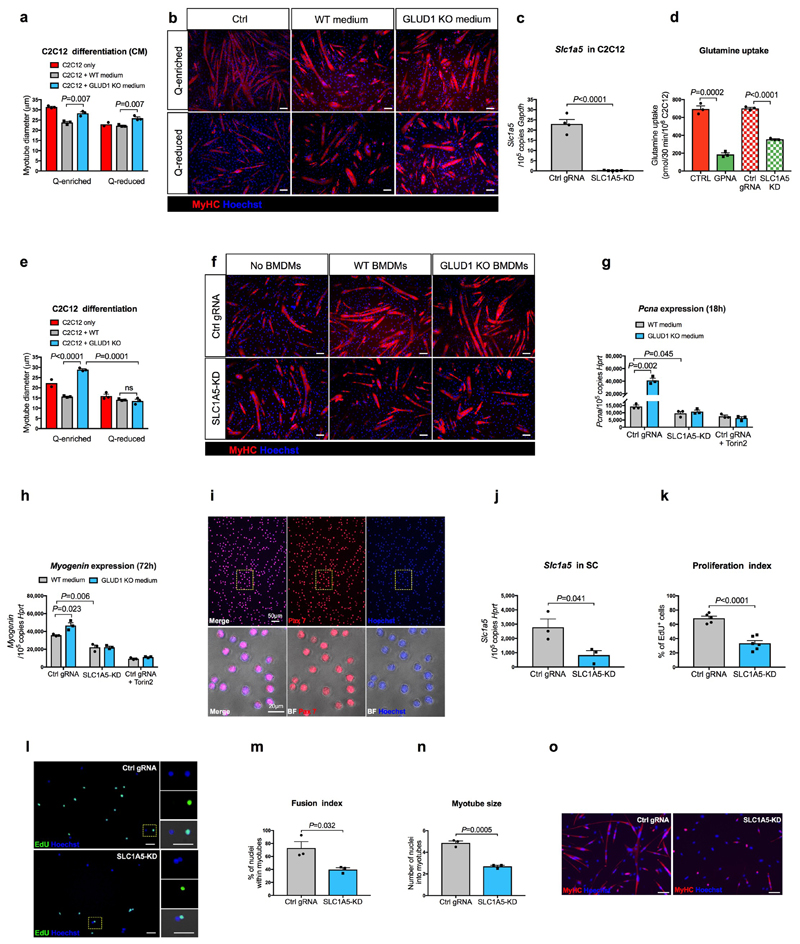
Extended Data Figure 5. Harnessing glutamine uptake in vitro.
a,b, Quantifications (a) and representative images (b) of myotube diameter in C2C12 cells cultured in BMDM-conditioned media (CM) (n=3 except for Q-reduced C2C12 where n=2).
c, RT-qPCR of SLC1A5 knockdown efficiency in C2C12 cells. Cells were transduced with a LV co-expressing Cas9 and a gRNA targeting the Slc1a5 locus (SLC1A5-KD) (n=5) or a non-targeting control gRNA (Ctrl gRNA) (n=4).
d, [U-14C]-glutamine uptake in SLC1A5-deficient C2C12 cells (SLC1A5 KD) generated by coexpressing Cas9 along with a gRNA targeting the Slc1a5 locus. Parental cells (CTRL) and cells transduced with a non-targeting control gRNA (Ctrl gRNA) were used as negative controls. C2C12 cells treated with SLC1A5 inhibitor gamma-L-Glutamyl-p-Nitroanilide (GPNA) were used as a positive control (n=3).
e-f, Quantification (e) and representative images (f) of myotube diameter in control or SLC1A5-KD C2C12 cells co-cultured with BMDMs under glutamine deprivation (n=3 except Ctrl C2C12 n=2).
g, RT-qPCR analysis of the proliferation marker Pcna in control or SLC1A5-KD C2C12 cells, or control C2C12 treated with the mTOR inhibitor Torin2, cultured for 18 hours in BMDM-conditioned, Q-reduced growth media, where the only glutamine present comes from WT or GLUD1 KO BMDMs. A non-targeting control gRNA (Ctrl gRNA) was used as control (n=3).
h, RT-qPCR analysis of the differentiation marker Myogenin in control or SLC1A5-KD C2C12 cells, or control C2C12 treated with the mTOR inhibitor Torin2, cultured for 72 hours in BMDM-conditioned, Q-reduced differentiation media, where the only glutamine present comes from WT or GLUD1 KO BMDMs. A non-targeting control gRNA (Ctrl gRNA) was used as control (n=3).
i, Representative images of an immunofluorescence for Pax7 on a pure SC population, freshly isolated from hindlimb muscles of WT mice.
j, RT-qPCR for Slc1a5 in SC, transduced with the same LV as above. The graph shows values of 3 biological repetitions per condition.
k-l, Quantification (k) and representative images (l) of EdU by immunofluorescence in control or SLC1A5-KD SC. A non-targeting control gRNA (Ctrl gRNA) was used as a control (Ctrl gRNA n=5; SLC1A5-KD n=6).
m-o, Quantification (m,n) and representative images (o) of fusion index and myotube size in control or SLC1A5-KD SC 5 days of culture in differentiation media. A non-targeting control gRNA (Ctrl gRNA) was used as a control. The graph shows values of 3 biological repetitions per condition.
All experiments show representative values of at least 2 independent experiments. Unpaired two-tailed t-test was everywhere applied; ns, not significant (P>0.05). Scale bars: 50 μm (b,f,l); 100 μm (o). Graphs show mean ± SEM.

