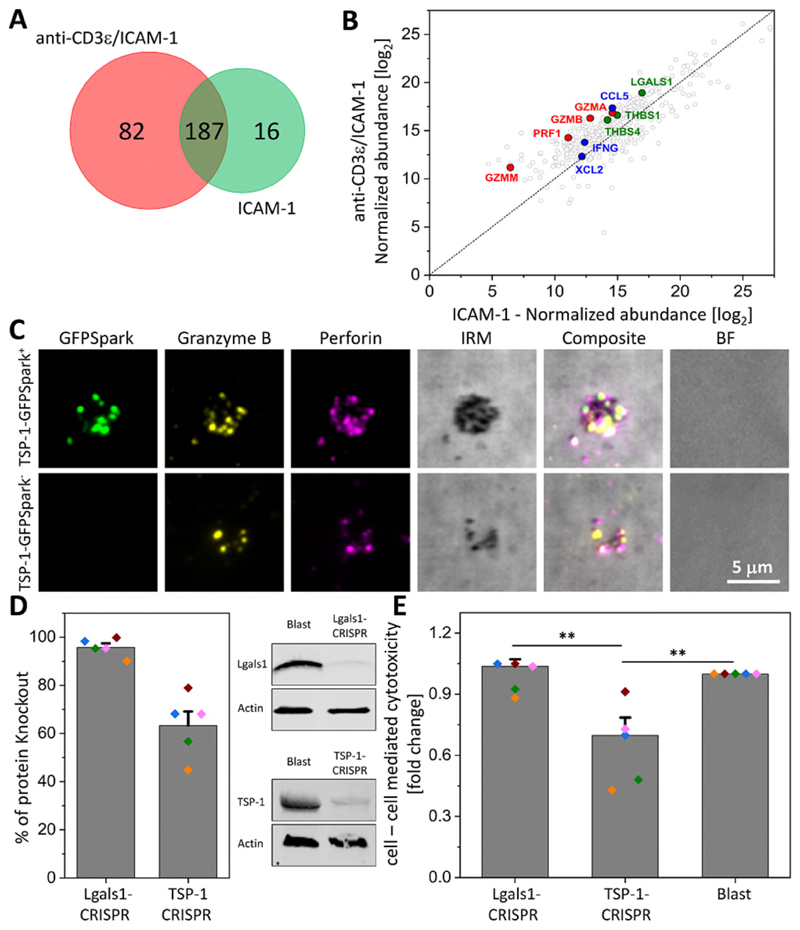
Fig. 2. TSP-1 was a major constituent of SMAPs and contributed to CTL killing of targets.
(A) Two-set Venn diagram showing the number of individual and common proteins identified by MS analysis of material released by CD8+ T-cells incubated on non-activating (ICAM-1) or activating (ICAM-1 + anti-CD3ε) SLB. Representative of 3 independent experiments with 8 donors. (B) Normalized abundance of the 285 proteins identified by MS in each condition. Cytotoxic proteins are highlighted in red, chemokine/cytokines in blue and adhesion proteins in green. (C) TIRFM images of SMAPs released from CD8+ T-cells transfected with TSP-1-GFPSpark (green; top row) or non-transfected cells (bottom row). Released SMAPs were further stained with anti-Gzmb (yellow) and anti-Prf1 (magenta) antibodies. IRM, interference reflection microscopy. BF, bright field microscopy. Scale bar, 5 μm. (D) Percentage of galectin-1 and TSP-1 knockout in CD8+ T-cells by CRISPR/Cas9 genome editing measured from immuno-blotting analysis (left). Each colored dot represents one donor. Bars represent mean ± SEM. Representative immuno-blot for galectin-1 (Lgals1) and TSP-1 in Lgals1 and TSP-1, respectively edited CD8+ T-cells (right). CD8+ T-cells (Blast) were analyzed in parallel as a control. (E) Target cell cytotoxicity mediated by galectin-1 (Lgals1-CRISPR) or TSP-1 (TSP-1-CRISPR) gene edited CD8+ T-cells measured by LDH release assay. T cell blasts were used as a control. Bars represent mean ± SEM. **, p < 0.01. Donors are the same as in (D).

