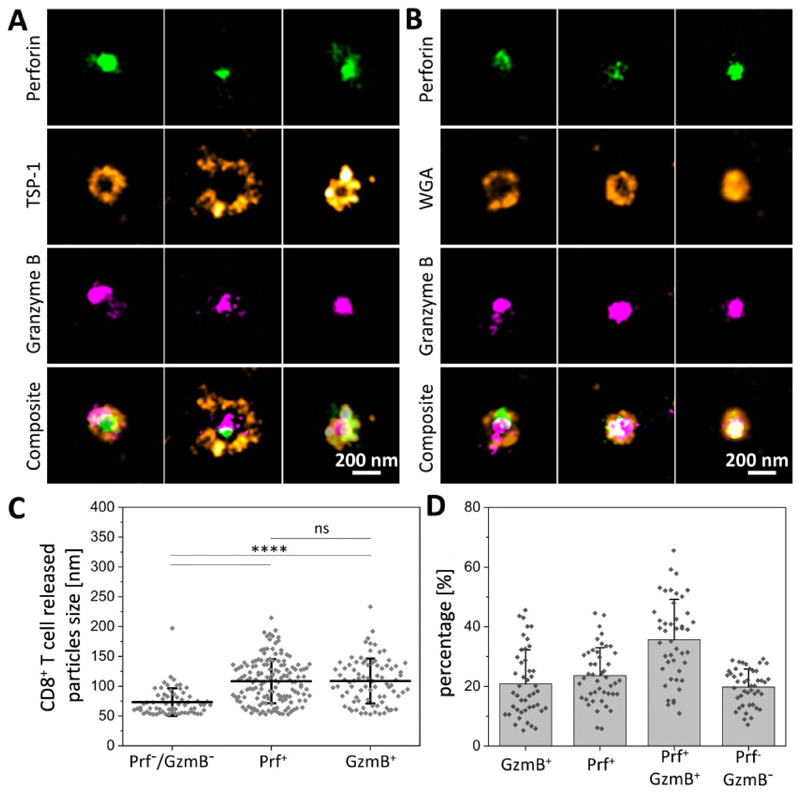
Fig. 4. SMAPs had a TSP-1 shell and a core of cytotoxic proteins.
(A and B) dSTORM images of individual SMAPs positive for Prf1 (green), Gzmb (magenta) and TSP-1 (A, orange) or stained with WGA (B, orange). Scale bar, 200 nm. (C) Quantification of the size of cytotoxic particles based on their protein composition (n=64 for Prf1- and Gzmb- cytotoxic particles, n=149 and n=83 for Prf1+ and Gzmb+ cytotoxic particles, respectively). ****, p < 0.0001. n.s, not significant. (D) Quantification of the percentage of particles positive and negative for Prf1 or Gzmb. (C-D) Horizontal lines/bars and error bars represent mean ± SD from five donors.

