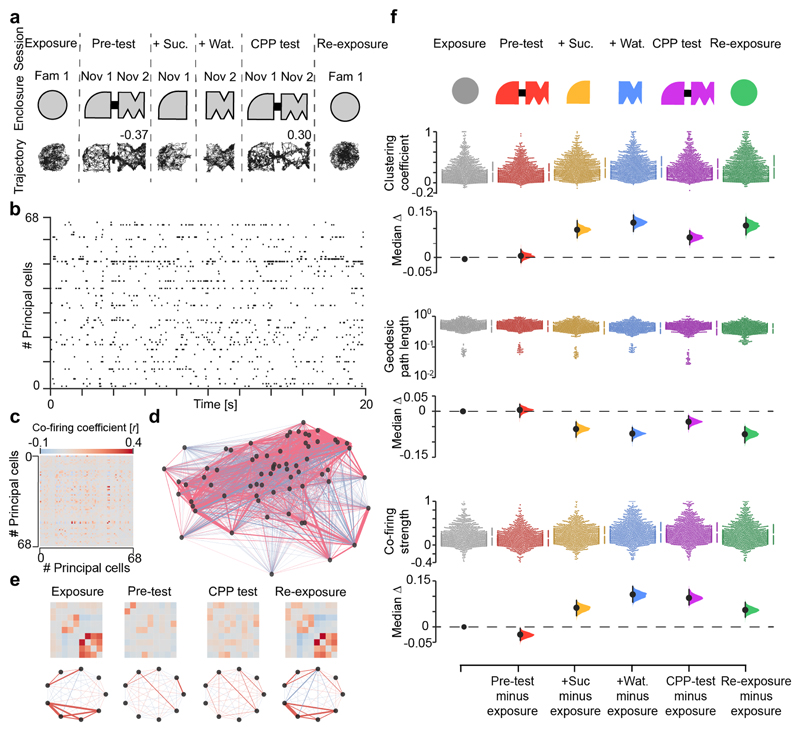
Figure 1. New CPP memory reorganizes pre-existing hippocampal co-firing topology.
(a) CPP task layout. Each day, mice explored the same familiar enclosure before and after a 4-session CPP task. Mouse trajectory in each session from one day is shown below the schematic of in-use enclosures. Numbers indicate place preference scores for pre-test and test, as the time in sucrose-paired compartment (+Suc.) minus that in water-paired compartment (+Wat.) over the sum. During CPP test, the mouse successfully changed its initial preference for the sucrose-paired compartment, as indicated by the positive score. (b) Example raster plot showing the spike trains of 68 simultaneously-recorded dCA1 principal cells (one cell per row) for the day shown in (a). For clarity, a 20-second sample is shown. (c) The corresponding adjacency matrix of the pairwise correlation coefficients measuring principal cells’ co-firing. (d) The corresponding co-firing graph. Each node represents one cell. Each edge represents the co-firing association of one cell pair, color-coded according to their correlation’s sign and width proportional to the edge’s absolute value. (e) Example adjacency matrices (top-row) and corresponding neuronal motifs (bottom-row) extracted from the graph shown in (d) to visualize some co-firing changes across sessions. (f) Changes in topological clustering (top), geodesic path length (middle) and single-neuron cumulative co-firing strength (bottom) of co-firing graphs. For each measure, the entire dataset is presented using a Cumming estimation plot to visualize the effect size; each upper panel shows the distribution of raw data points (each point represents one cell) for each color-coded session (with the gapped lines on the right as mean (gap) ± SD (vertical ends) for each session); each lower panel displays the difference between a given session and the exposure, computed from 5,000 bootstrapped resamples and with difference-axis origin aligned to the median of the exposure distribution. For each task-session: black-dot, median; black-ticks, 99% confidence interval; filled-curve: sampling-error distribution.

