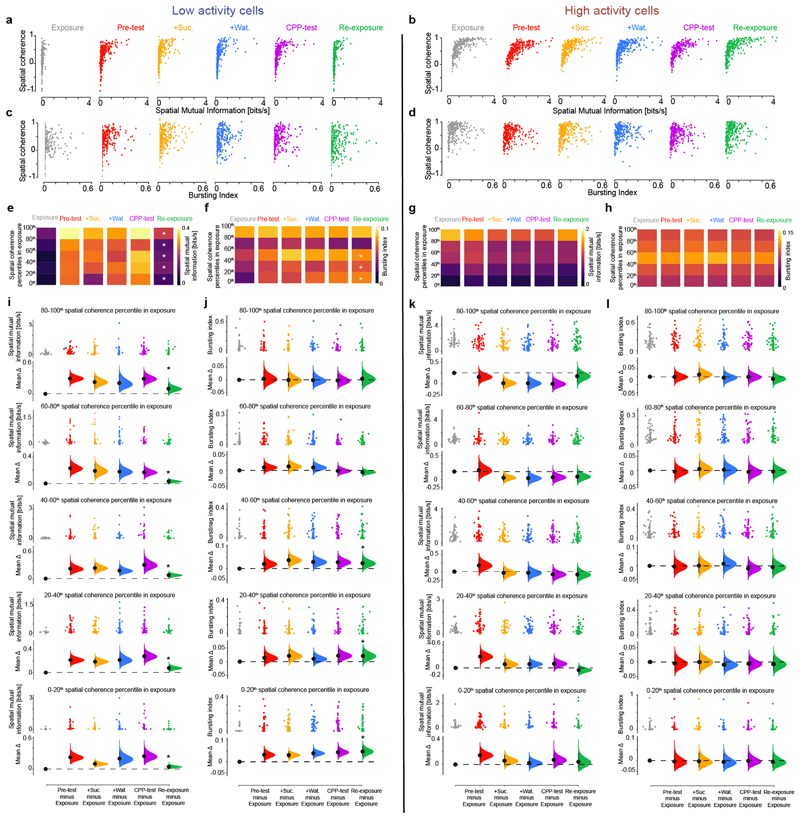
Extended Data Fig. 9. Relation between spatial field coherence during exposure and subsequent changes in both burstiness and spatial information for low and high activity cells in the CPP task.
(a,b) The spatial mutual information of low and high activity cells is plotted against their respective spatial coherence for each of the six CPP task sessions. Each data point represents one cell. Comparing with exposure, note the right-shift towards higher spatial information for a set of low activity cells during the CPP sessions, which then remained at higher values during re-exposure (a). (c,d) Similarly, the bursting index of low and high activity cells is plotted against their spatial coherence for each CPP task session. Also comparing with exposure, note the right-shift towards higher spike bursting in the distributions of low activity cells during CPP sessions, remaining higher during re-exposure (c). (e-h) For each of the six CPP task sessions, both low (e,f) and high (g,h) activity cell subpopulations were binned in 20th-percentiles according to the spatial coherence of each cell’s place field during the exposure session. Then, the average spatial mutual information (e,g) and bursting index (f,h) were computed for each 20th-percentile bins across all task sessions. For clarity, the bins of the re-exposure session marked with a white star (*) have significant changes in either measure (spatial information or bursting index) compared to the corresponding bins in the exposure session. Note that during re-exposure, low activity cells show significant increase in spatial information following CPP compared to exposure (e). This was not the case for high activity cells (g). Moreover, low activity cells with the least (0th–60th percentiles) spatial coherence during exposure increased their spike bursting during the CPP sessions and thereafter during re-exposure (f; with statistically different percentile bins marked with a white star compared to their corresponding bins in exposure). This was not seen for high activity cells (h). (i-l) Cumming estimation plots showing the effect size for changes in spatial information (i,k) and bursting index (j,l) for the low (i,j) and the high (k,l) activity cell subpopulations, binned as 20th-percentiles according to the spatial coherence of each cell’s place field during exposure. For further clarity, the black stars above the green filled-curves in re-exposure indicate significant changes compared to exposure. Note that across all percentile bins, low activity cells show significant increase in spatial information in re-exposure compared to exposure (i). This was not seen for high activity cells (k). Moreover, low activity cells with the least (0th–60th percentiles) spatial coherence during exposure thereafter discharged more spike bursts during the CPP sessions and continued to exhibit significant higher burstiness during re-exposure compared to exposure (f,j; see stars). High activity cells maintained the same burstiness throughout all task sessions (h,l). For each Cumming estimation plot: black-dot, mean; black-ticks, 95% confidence interval; filled-curve: bootstrapped sampling-error distribution. Altogether, these analyses show that CPP learning subsequently affected low activity cells during re-exposure to the familiar environment. Notably, these results show that the dCA1 network gained in spatial information content during re-exposure (compared to exposure) from both: (1) low activity cells that were already spatially tuned during exposure and then exhibited higher spatial informativeness following CPP (e,i), and (2) low activity cells that were not spatially tuned during exposure but were de-novo recruited during CPP, after which they stayed more active during re-exposure (f,j). These results are in line with the increase in spatial coherence observed for the most burst spiking of the low, but not high, activity cells during re-exposure compared to exposure (Extended Data Fig. 8a), and the gradual engagement of low activity cells in whole-network co-firing motifs (see Fig. 3c and Extended Data Fig. 10d).

