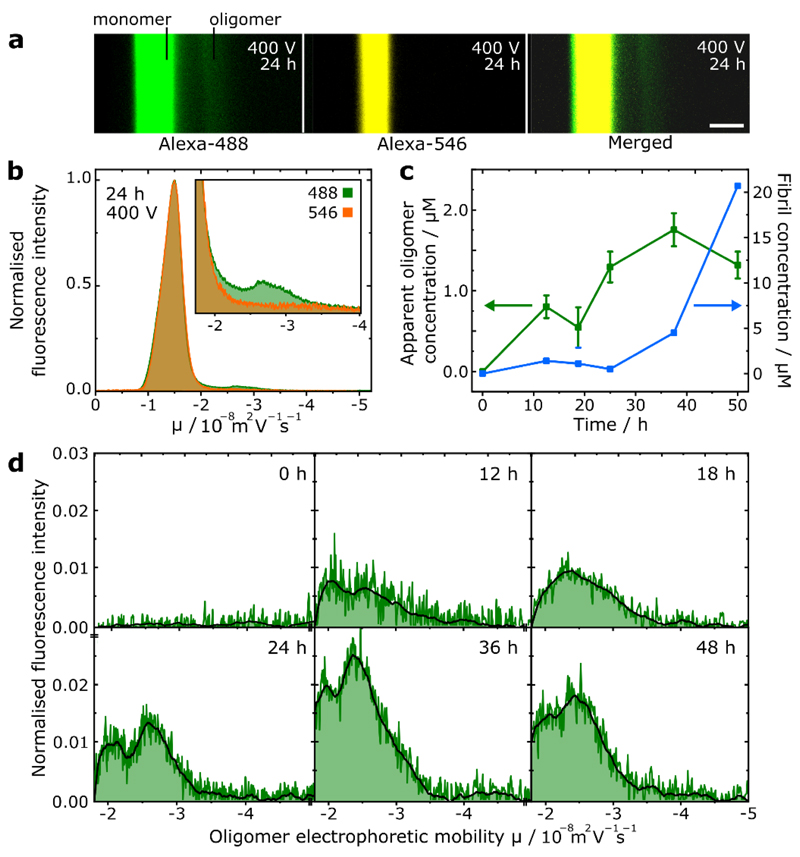
Figure 2.
(a) Fluorescence images of μFFE experiment of transient oligomers formed after 24 h αS aggregation. Scale bar = 300 μm. (b) Superimposed electropherograms of normalised alexa-488 and 546 fluorescence for micrographs shown in (a), (inset) magnification of electropherograms showing oligomeric region. (c) Scatter plot showing progression of oligomer concentration (monomer equivalents) and extent of monomer to fibril conversion (fibril concentration in monomer equivalents) over the sampled time points. Error bars correspond to standard deviation of three repeat measurements of the same sample. (d) Electropherograms and smoothed traces corresponding to oligomeric species only at each sampled aggregation time point.

