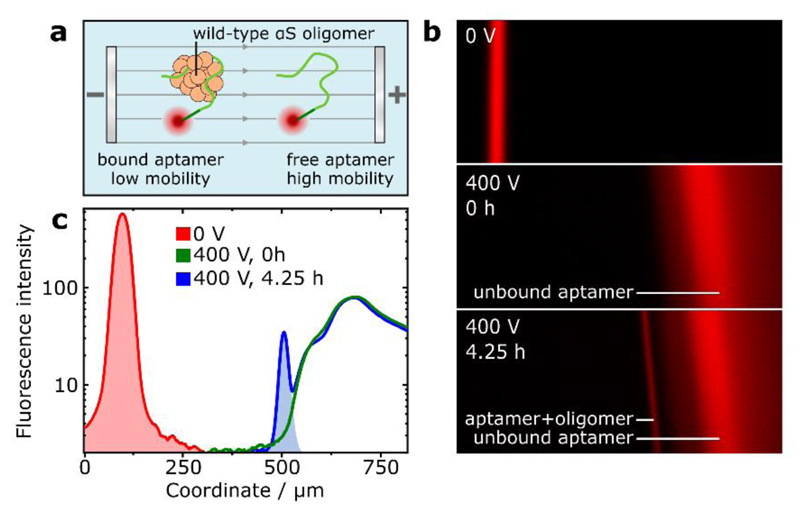
Figure 3.
(a) Schematic for fractionation of oligomer-bound and unbound aptamer by μFFE. (b) Images of aptamer fluorescence during μFFE, from aptamer mixed into an aggregation reaction of wild-type αS at 0 h and 4.25 h timepoints. Additional, lower-mobility fraction after 4.25 h indicates aptamer-oligomer binding. (c) Analysis and integration of aptamer electropherograms enable approximation of the concentration of aptamer-bound oligomers.

