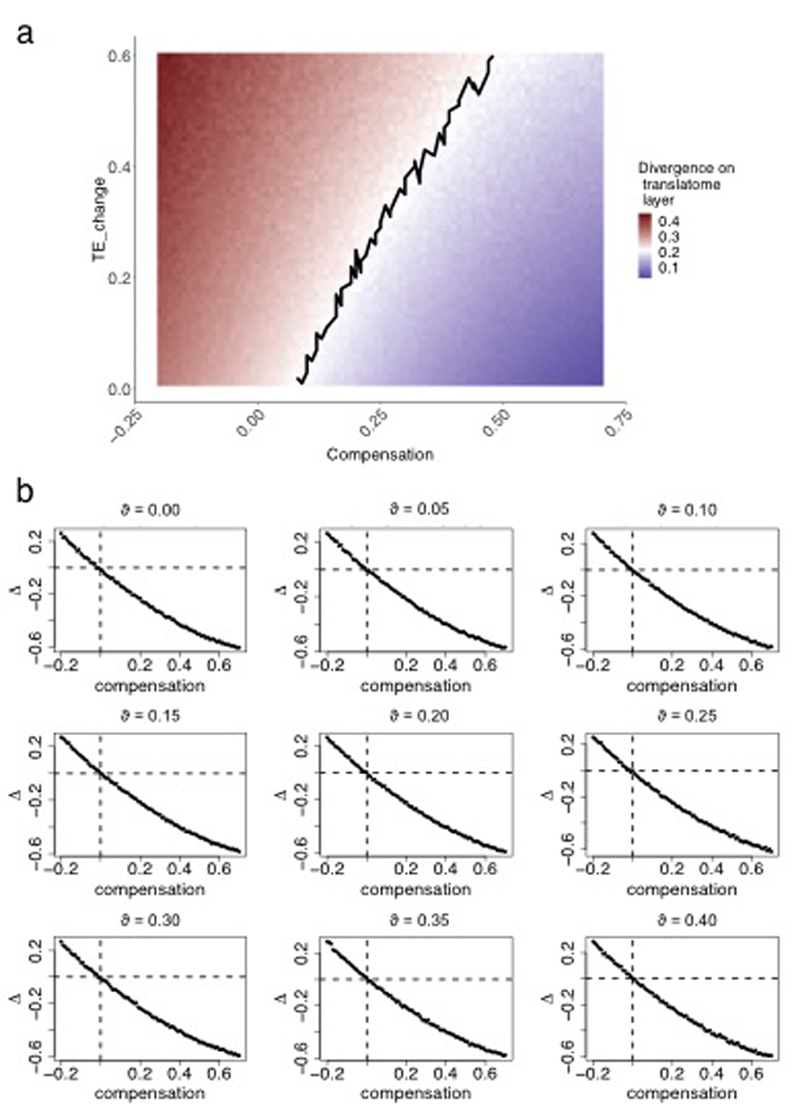
Extended Data Fig. 6. Simulation of gene expression divergence across expression layers.
a, Simulation of gene expression divergence across different evolutionary scenarios. Expression divergence at the translatome layer between macaque and mouse brain was modeled over parameters of compensation and TE change (see “Modeling gene expression divergence” in Methods for details). Red (blue) correspond to simulated scenarios with expression divergence higher (lower) than in actual data. Black line corresponds to simulated scerarios demonstrating expression divergence values observed in actual data. b, Contrast in evolutionary rates between the two expression layers for simulated data. Δ was calculated for simulated datasets with different amounts of compensation and different amounts of, corresponding to expression variation between individuals and measurement errors (see Methods for details).

