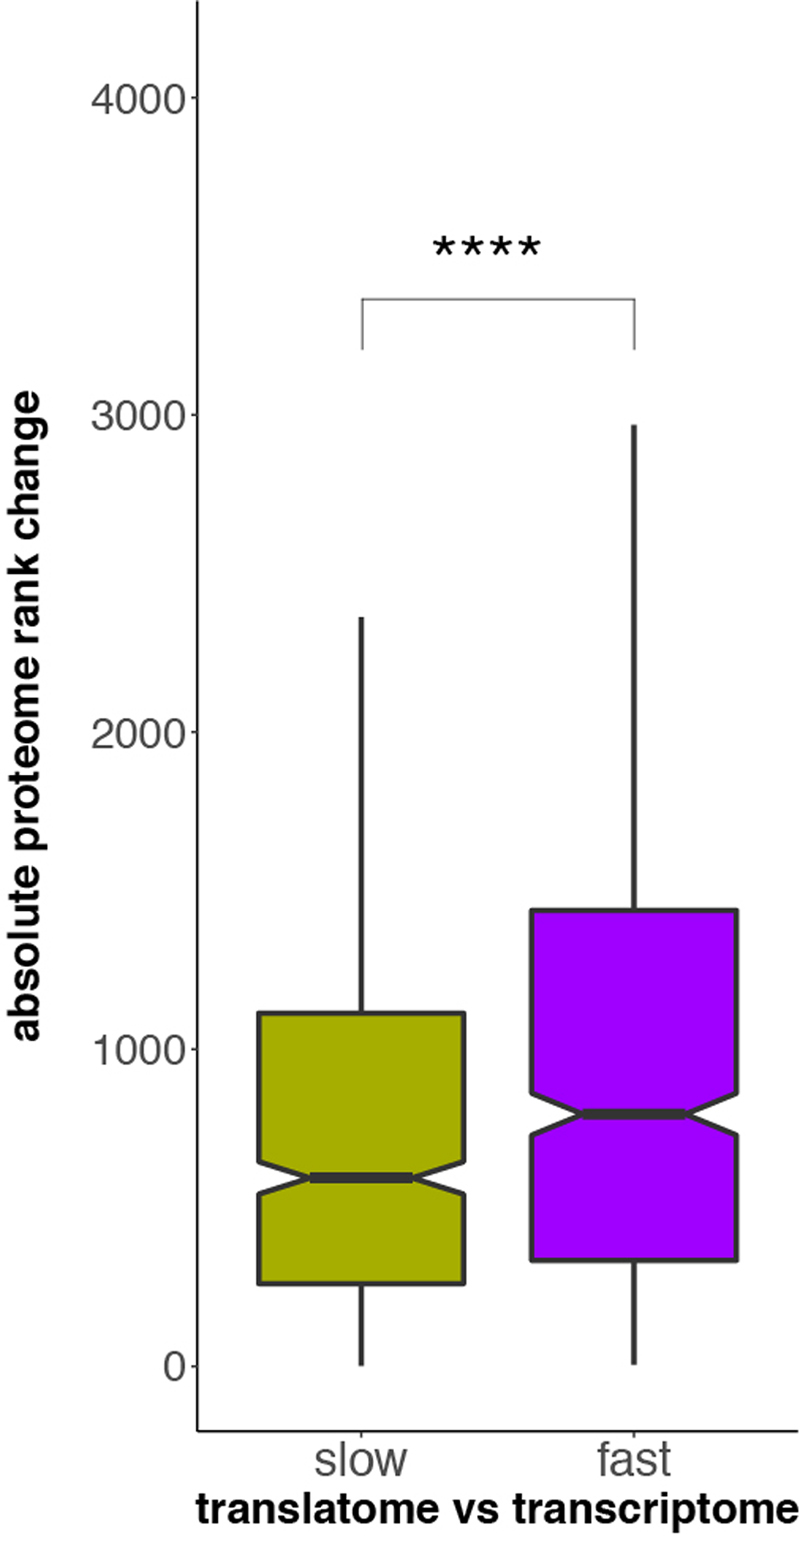
Extended Data Fig. 9. Evolution at the proteome layer between human and mouse brain for genes with slower/faster evolution at the translatome compared to the transcriptome layer.
Absolute rank changes of proteome expression levels were calculated for genes with slower (olive) and faster (purple) evolution at the translatome compared to the transcriptome layer. The difference of the distributions between the two gene sets is statistically significant (****P < 0.0001, Mann-Whitney U test, two-sided). Box plots represent the median ± 25th and 75th percentiles, whiskers are at 1.5 times the interquartile range.

