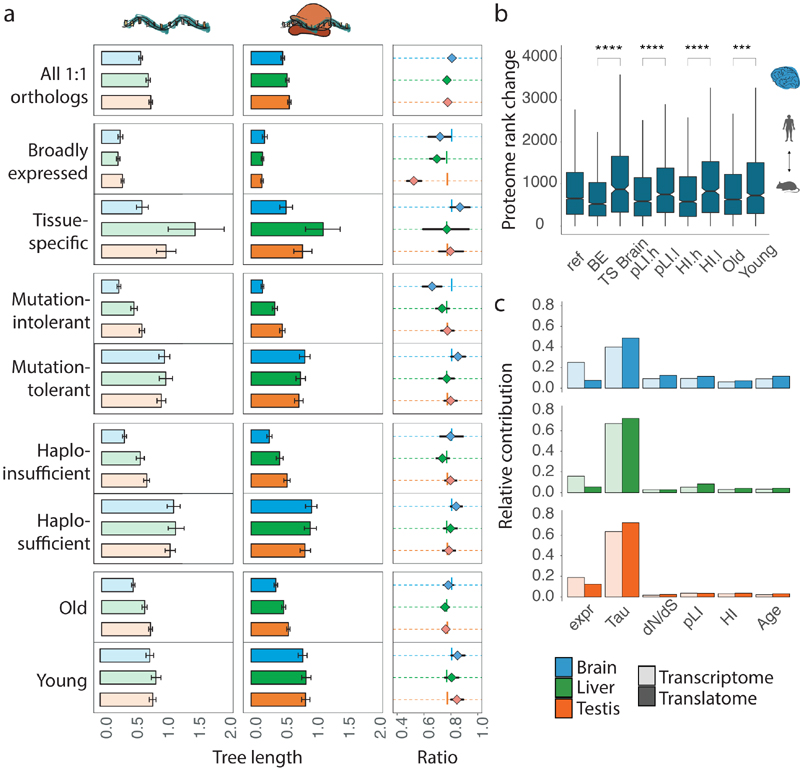
Fig. 3. Co-evolution of expression layers across gene classes.
a, Gene-expression divergence at the two expression layers was calculated for all 8,109 1:1 orthologues robustly expressed (FPKM > 1) in macaque, mouse and opossum (Ref), and for specific gene sets: genes with particular spatial expression patterns (broadly expressed (BE) or tissue-specific (TS)); genes with a high (mutation-intolerant, pLI.h) or low (mutation-tolerant, pLI.l) probability of being loss-of-function-intolerant; genes with high (haploinsufficient, HI.h) or low (haplosufficient, HI.l) sensitivity to copy number reductions; and genes that duplicated in the common bony vertebrate ancestor (old) or that have duplication origins in tetrapods (young). Analysis was restricted to three species to increase the number of available 1:1 orthologues. Ratios between rates of gene-expression divergence (translational to transcriptional) are shown to the right of each set of bar plots (vertical lines indicate ratios obtained for the complete set of orthologues). Error bars correspond to 95% confidence intervals, calculated based on 1,000 bootstrap replicates. b, Absolute rank changes of proteome gene expression levels were calculated across the same categories for 6,972 1:1 orthologues, detected in human and mouse brains at all three expression layers; Mann-Whitney U tests (two-sided) were performed for statistical comparisons (***P = 0.00034, ****P < 0.0001). Box plots represent the median ± 25th and 75th percentiles, whiskers are at 1.5 times the interquartile range. c, Contribution of different factors to gene expression divergence rates at the transcriptional and translational layers. Expr, gene expression level (as log2(FPKM+1)); Tau, tissue-specificity, measured as τ; dN/dS, ratio of substitutions in non-synonymous to synonymous sites; pLI – loss of function intolerance; HI – haploinsufficiency; Age – age of the last duplication. Organ and species icons were previously used in ref. 25.

