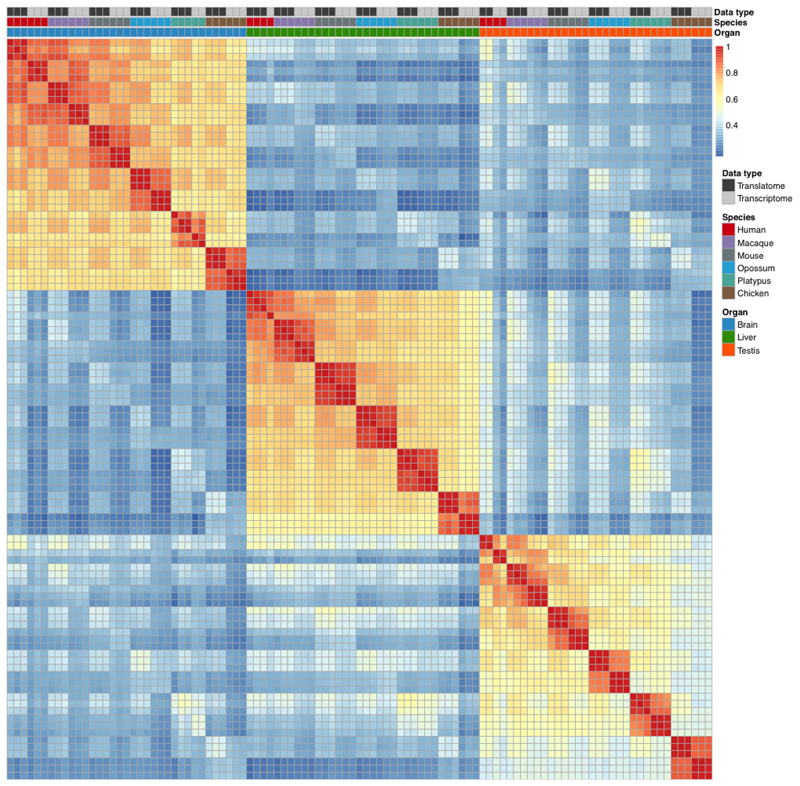
Extended Data Fig. 2. Correlations of gene expression levels between sequenced libraries.
The heatmap of the pairwise Spearman’s correlation coefficient (ρ) is based on the set of 5,060 robustly expressed (median FPKM > 1 across organ libraries) 1:1 amniote orthologues for perfectly aligned regions (see Methods). It represents the degree of similarity of gene expression profiles between data types (translatome, transcriptome), species (human, macaque, mouse, opossum, platypus, chicken) and tissues (brain, liver, testis).

