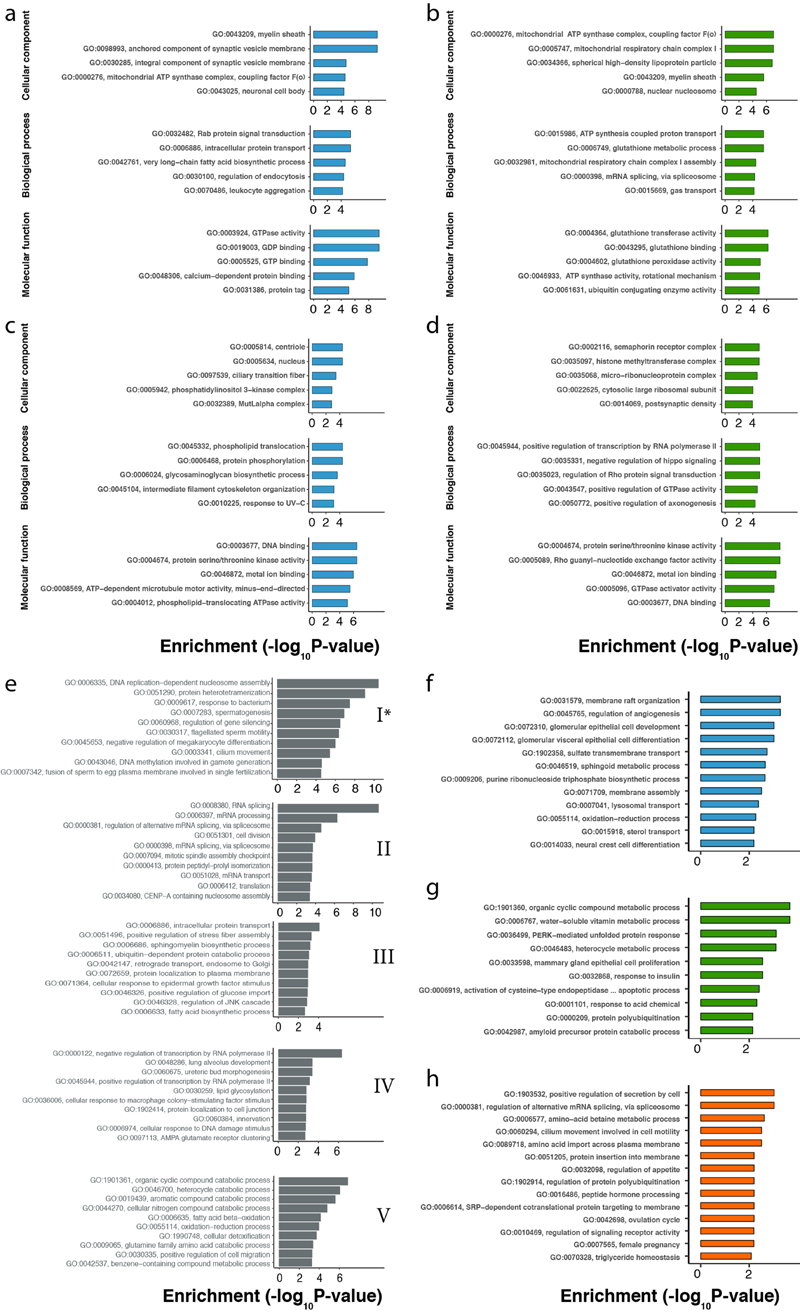
Extended Data Fig. 4. GO enrichment analyses.
a-d, Top 5 significantly enriched GO terms among genes with high (a, b) and low (c, d) TE for brain (a, c; blue) and liver (b, d; green) in mouse. e, Top 10 significantly enriched GO terms for each of the mouse spermatogenesis TE trajectory cluster (Extended Data Fig. 3h-k). f-h, Significantly enriched GO terms (biological processes) among genes that changed significantly more at the translatome compared to the transcriptome layer in brain (f), liver (g), and testis (h). Significance was estimated in Fisher’s exact test (P < 0.05), with P values adjusted for multiple testing using Benjamini-Hochberg method.

