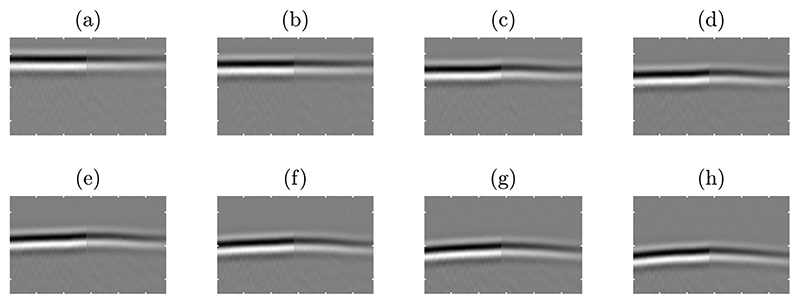
Figure 9.
Simulated received wavefronts by the effective aperture after geometric compensation. Wavefronts are shown on a linear grey scale with time as the vertical axis and element number as the horizontal axis. The temporal range shown is 2.92 ms for 288 elements. Cases with different thicknesses of fat layer are shown: (a) 0 mm (control case); (b) 5 mm; (c) 10 mm; (d) 15 mm; (e) 20 mm; (f) 25 mm; (g) 30 mm; (h) 35 mm.

