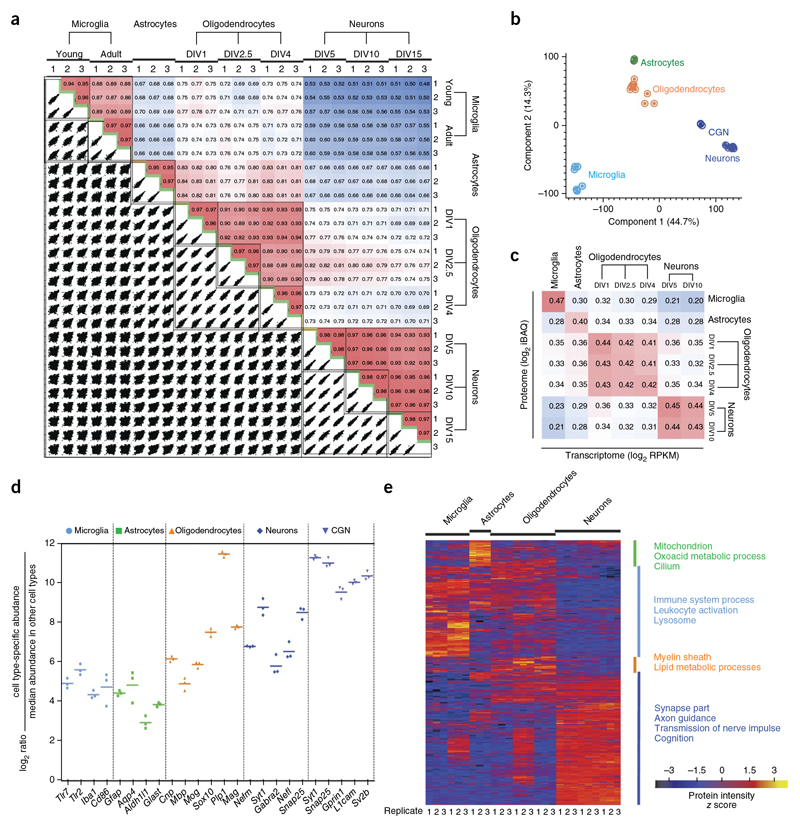
Figure 2. Comparative analysis of cell proteomes.
(a) The matrix of 162 correlation plots revealed very high correlations between LFQ intensities in triplicates (Pearson correlation coefficient 0.94–0.98 between cell types). The color code follows the indicated values of correlation coefficient. (b) PCE. The proteome of all cell types and their differentiation states measured in triplicates segregated into major cell types based on component 1 and component 2, which account for 44.7% and 14.3% of variability, respectively. (c) Correlation plots of iBAQ intensities (proteome) versus RPKM values (transcriptome).The color follows the indicated values of correlation coefficient. (d) Fold expression of the indicated marker proteins in individual replicates is shown on a log2 scale as points with mean in the specified cell type in comparison with other cell types. (e) Heat map of proteins differentially expressed across different cell types (n = 3 for each cell type). The top categories enriched for clusters are shown. Heat map of z-scored LFQ intensities of the significantly differentially expressed proteins after unsupervised hierarchical clustering. Proteins are divided into four clusters showing the top categorical annotations enriched after a Fisher’s exact test (P ═0.02).

